Estimated Value: $402,000 - $457,000
2
Beds
1
Bath
1,610
Sq Ft
$265/Sq Ft
Est. Value
About This Home
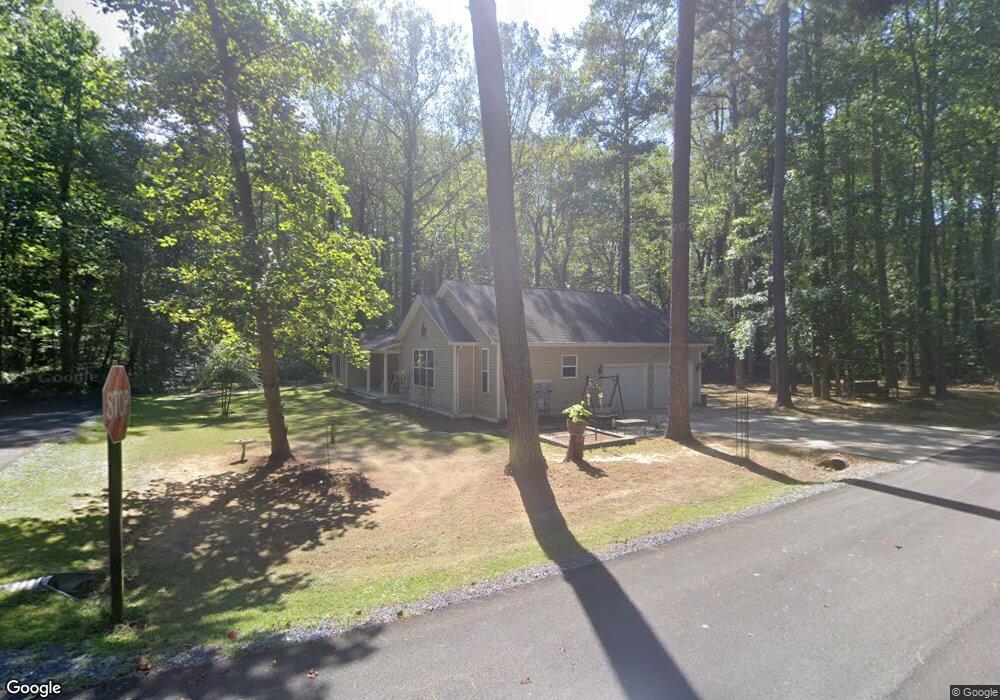
This home is located at 12971 Walsh Ln, Lusby, MD 20657 and is currently estimated at $426,183, approximately $264 per square foot. 12971 Walsh Ln is a home located in Calvert County with nearby schools including Dowell Elementary School, Mill Creek Middle School, and Patuxent High School.
Ownership History
Date
Name
Owned For
Owner Type
Purchase Details
Closed on
Sep 9, 2014
Sold by
Wright Darryl Wayne and Cravens Jerry R
Bought by
Hartley George L and Hartley Mary M
Current Estimated Value
Home Financials for this Owner
Home Financials are based on the most recent Mortgage that was taken out on this home.
Original Mortgage
$286,020
Outstanding Balance
$218,805
Interest Rate
4.12%
Mortgage Type
VA
Estimated Equity
$207,378
Purchase Details
Closed on
Dec 28, 2010
Sold by
Hsbc Bank Usa National Assoc
Bought by
Wright Darryl Wayne and Cravens Jerry R
Purchase Details
Closed on
Nov 17, 2010
Sold by
Westfall Willis W
Bought by
H S B C Bank Usa National Assoc
Purchase Details
Closed on
Aug 2, 1995
Sold by
Hemm W C
Bought by
Westfall Willis W
Home Financials for this Owner
Home Financials are based on the most recent Mortgage that was taken out on this home.
Original Mortgage
$83,000
Interest Rate
7.48%
Create a Home Valuation Report for This Property
The Home Valuation Report is an in-depth analysis detailing your home's value as well as a comparison with similar homes in the area
Home Values in the Area
Average Home Value in this Area
Purchase History
| Date | Buyer | Sale Price | Title Company |
|---|---|---|---|
| Hartley George L | $280,000 | Titlemax Llc | |
| Wright Darryl Wayne | $95,000 | -- | |
| H S B C Bank Usa National Assoc | $125,000 | -- | |
| Westfall Willis W | $83,000 | -- |
Source: Public Records
Mortgage History
| Date | Status | Borrower | Loan Amount |
|---|---|---|---|
| Open | Hartley George L | $286,020 | |
| Previous Owner | Westfall Willis W | $83,000 |
Source: Public Records
Tax History Compared to Growth
Tax History
| Year | Tax Paid | Tax Assessment Tax Assessment Total Assessment is a certain percentage of the fair market value that is determined by local assessors to be the total taxable value of land and additions on the property. | Land | Improvement |
|---|---|---|---|---|
| 2025 | $3,803 | $325,933 | $0 | $0 |
| 2024 | $3,803 | $299,867 | $0 | $0 |
| 2023 | $3,409 | $273,800 | $67,300 | $206,500 |
| 2022 | $3,371 | $270,467 | $0 | $0 |
| 2021 | $3,189 | $267,133 | $0 | $0 |
| 2020 | $3,189 | $263,800 | $67,300 | $196,500 |
| 2019 | $2,962 | $244,233 | $0 | $0 |
| 2018 | $2,719 | $224,667 | $0 | $0 |
| 2017 | $2,536 | $205,100 | $0 | $0 |
| 2016 | -- | $184,900 | $0 | $0 |
| 2015 | $1,936 | $164,700 | $0 | $0 |
| 2014 | $1,936 | $144,500 | $0 | $0 |
Source: Public Records
Map
Nearby Homes
- 257 Lessin Dr
- 310 Mcmichaels Dr
- 12948 Walsh Ln
- 330 Lessin Dr
- 340 Chestnut Dr
- 12924 Rousby Hall Rd
- 13109 River View Dr
- 422 Lessin Dr
- 298 Cove Dr
- 419 Seagull Ln
- 13155 Rousby Hall Rd
- 12963 Mills Creek Dr
- 12987 Holly Way
- 422 Overlook Dr
- 13021 Mills Creek Dr
- 460 Deer Ln
- 421 Overlook Dr
- 454 Dogwood Dr
- 12887 Ships Way
- 484 Lake Dr
- 265 Lessin Dr
- 261 Lessin Dr
- 12975 Walsh Ln
- 256 Michael Dr Unit MC
- 12972 Walsh Ln
- 256 Mcmichaels Dr
- 252 Mcmichaels Dr
- 12968 Walsh Ln
- 252 Michael Dr Unit MC
- 12963 Walsh Ln
- 304 Lessin Dr
- 258 Mcmichaels Dr
- 258 Michael Dr Unit MC
- 260 Lessin Dr
- 302 Lessin Dr
- 308 Lessin Dr
- 250 Michael Dr Unit MC
- 256 Lessin Dr
- 250 Mcmichaels Dr
- 249 Lessin Dr