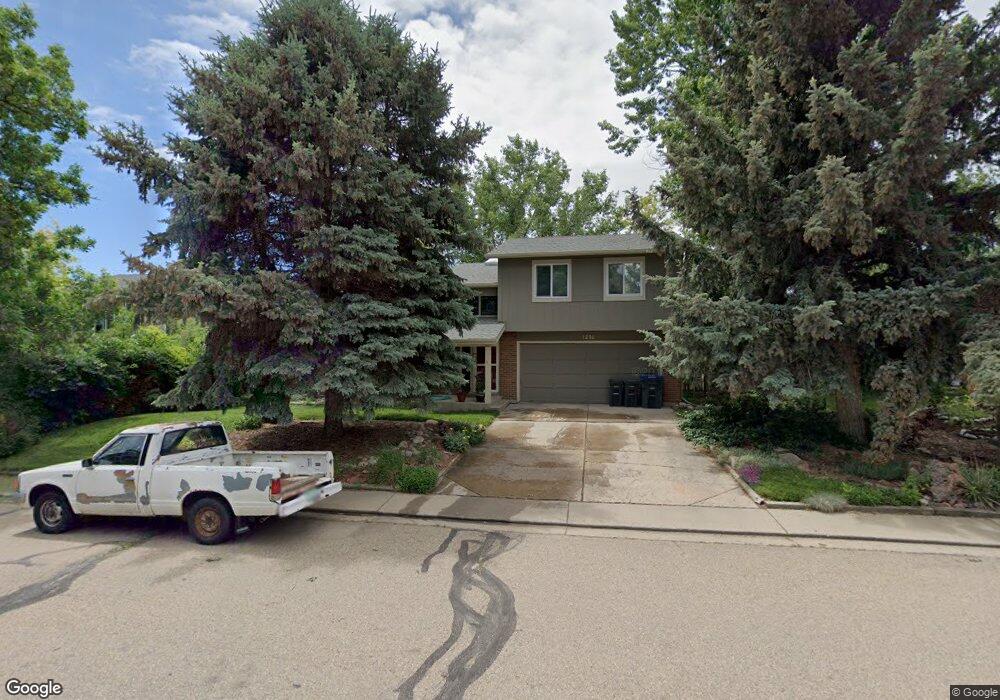
1298 Ceres Dr Lafayette, CO 80026
Estimated Value: $644,107 - $721,000
3
Beds
3
Baths
1,180
Sq Ft
$567/Sq Ft
Est. Value
About This Home
This home is located at 1298 Ceres Dr, Lafayette, CO 80026 and is currently estimated at $669,027, approximately $566 per square foot. 1298 Ceres Dr is a home located in Boulder County with nearby schools including Ryan Elementary School, Angevine Middle School, and Centaurus High School.
Ownership History
Date
Name
Owned For
Owner Type
Purchase Details
Closed on
Feb 28, 2011
Sold by
Koeller Christopher R
Bought by
Koeller Christopher R
Current Estimated Value
Home Financials for this Owner
Home Financials are based on the most recent Mortgage that was taken out on this home.
Original Mortgage
$147,000
Outstanding Balance
$6,758
Interest Rate
4.73%
Mortgage Type
New Conventional
Estimated Equity
$662,269
Purchase Details
Closed on
Mar 29, 2000
Sold by
Thompson Russell G and Thompson Karen J
Bought by
Koeller Christopher R
Home Financials for this Owner
Home Financials are based on the most recent Mortgage that was taken out on this home.
Original Mortgage
$166,400
Interest Rate
8.27%
Purchase Details
Closed on
Sep 8, 1983
Bought by
Koeller Christopher R and Koeller Suyapa Koeller-Amador
Purchase Details
Closed on
Nov 13, 1980
Bought by
Koeller Christopher R and Koeller Suyapa Koeller-Amador
Create a Home Valuation Report for This Property
The Home Valuation Report is an in-depth analysis detailing your home's value as well as a comparison with similar homes in the area
Home Values in the Area
Average Home Value in this Area
Purchase History
| Date | Buyer | Sale Price | Title Company |
|---|---|---|---|
| Koeller Christopher R | -- | Heritage Title | |
| Koeller Christopher R | $208,000 | -- | |
| Koeller Christopher R | $94,000 | -- | |
| Koeller Christopher R | $75,000 | -- |
Source: Public Records
Mortgage History
| Date | Status | Borrower | Loan Amount |
|---|---|---|---|
| Open | Koeller Christopher R | $147,000 | |
| Closed | Koeller Christopher R | $166,400 |
Source: Public Records
Tax History Compared to Growth
Tax History
| Year | Tax Paid | Tax Assessment Tax Assessment Total Assessment is a certain percentage of the fair market value that is determined by local assessors to be the total taxable value of land and additions on the property. | Land | Improvement |
|---|---|---|---|---|
| 2025 | $3,277 | $36,506 | $16,581 | $19,925 |
| 2024 | $3,277 | $36,506 | $16,581 | $19,925 |
| 2023 | $3,221 | $36,984 | $16,583 | $24,086 |
| 2022 | $2,783 | $29,627 | $12,948 | $16,679 |
| 2021 | $2,753 | $30,480 | $13,320 | $17,160 |
| 2020 | $2,680 | $29,323 | $10,654 | $18,669 |
| 2019 | $2,643 | $29,323 | $10,654 | $18,669 |
| 2018 | $2,331 | $25,531 | $10,224 | $15,307 |
| 2017 | $2,269 | $28,226 | $11,303 | $16,923 |
| 2016 | $2,036 | $22,171 | $8,233 | $13,938 |
| 2015 | $1,907 | $18,189 | $4,776 | $13,413 |
| 2014 | $1,573 | $18,189 | $4,776 | $13,413 |
Source: Public Records
Map
Nearby Homes
- 1245 Ceres Dr
- 1711 Cato Cir Unit 21
- 1805 Chalcis Dr Unit A39
- 928 Cimarron Dr Unit c
- 805 Argos Cir
- 925 Sparta Dr
- 1407 Lydia Dr Unit 61
- 725 Julian Cir
- 1836 Lakespur Ln
- 2034 Gyros Cir Unit 153
- 718 Julian Cir
- 880 Orion Dr
- 1053 Delta Dr Unit B
- 1065 Delta Dr Unit A
- 911 Homer Cir
- 1191 Milo Cir Unit A
- 1117 Elysian Field Dr Unit B
- 1111 Elysian Field Dr Unit D
- 1116 Elysian Field Dr Unit F
- 1045 Milo Cir Unit A