Estimated Value: $155,000 - $184,943
2
Beds
2
Baths
1,064
Sq Ft
$162/Sq Ft
Est. Value
About This Home
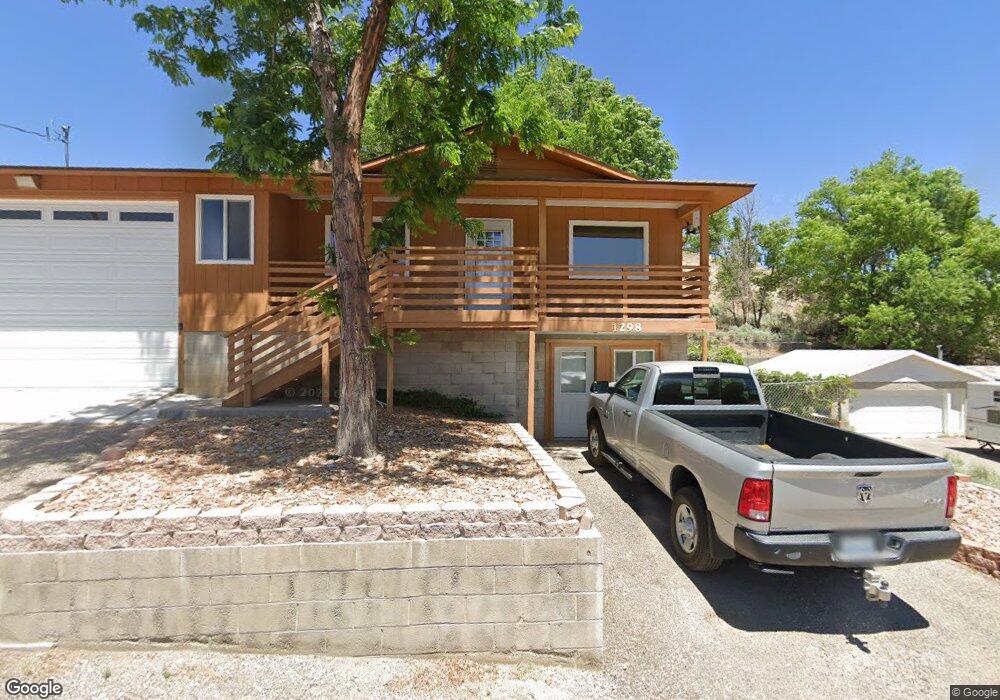
This home is located at 1298 Ely St, Ely, NV 89301 and is currently estimated at $172,736, approximately $162 per square foot. 1298 Ely St is a home located in White Pine County with nearby schools including David E. Norman Elementary School, White Pine Middle School, and White Pine High School.
Ownership History
Date
Name
Owned For
Owner Type
Purchase Details
Closed on
Jan 3, 2019
Sold by
Phillips Lloyd E and Phillips Jean B
Bought by
Phillips Lloyd and Phillips Nyla Jean
Current Estimated Value
Purchase Details
Closed on
Jun 21, 2018
Sold by
Phillips Nyla J and Phillips Lloyd E
Bought by
Phillips Lloyd E
Home Financials for this Owner
Home Financials are based on the most recent Mortgage that was taken out on this home.
Original Mortgage
$86,487
Interest Rate
4.6%
Mortgage Type
FHA
Create a Home Valuation Report for This Property
The Home Valuation Report is an in-depth analysis detailing your home's value as well as a comparison with similar homes in the area
Home Values in the Area
Average Home Value in this Area
Purchase History
| Date | Buyer | Sale Price | Title Company |
|---|---|---|---|
| Phillips Lloyd | $69,289 | None Available | |
| Phillips Lloyd E | $70,154 | Stewart Title Company | |
| Phillips Lloyd E | $70,154 | Stewart Title Company |
Source: Public Records
Mortgage History
| Date | Status | Borrower | Loan Amount |
|---|---|---|---|
| Previous Owner | Phillips Lloyd E | $86,487 |
Source: Public Records
Tax History
| Year | Tax Paid | Tax Assessment Tax Assessment Total Assessment is a certain percentage of the fair market value that is determined by local assessors to be the total taxable value of land and additions on the property. | Land | Improvement |
|---|---|---|---|---|
| 2025 | $1,118 | $29,824 | $4,541 | $25,283 |
| 2024 | $1,118 | $30,610 | $4,069 | $26,541 |
| 2023 | $1,118 | $29,257 | $4,069 | $25,188 |
| 2022 | $899 | $23,574 | $3,544 | $20,030 |
| 2021 | $886 | $23,227 | $3,544 | $19,683 |
| 2020 | $943 | $24,792 | $3,544 | $21,248 |
| 2019 | $943 | $24,791 | $3,544 | $21,247 |
| 2018 | $924 | $24,251 | $3,544 | $20,707 |
| 2017 | $935 | $24,554 | $3,229 | $21,325 |
| 2016 | $954 | $25,188 | $3,229 | $21,959 |
| 2015 | $940 | $25,298 | $3,229 | $22,069 |
| 2014 | $940 | $25,792 | $3,833 | $21,959 |
Source: Public Records
Map
Nearby Homes
Your Personal Tour Guide
Ask me questions while you tour the home.