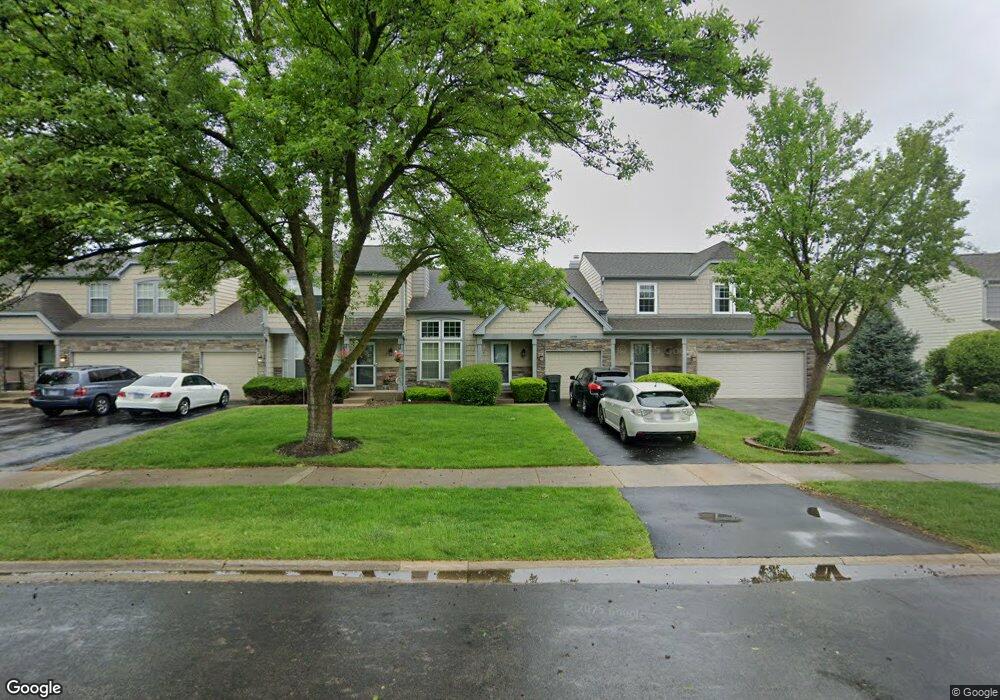
1298 Gloucester Cir Carol Stream, IL 60188
Estimated Value: $311,000 - $355,000
3
Beds
2
Baths
1,340
Sq Ft
$244/Sq Ft
Est. Value
About This Home
This home is located at 1298 Gloucester Cir, Carol Stream, IL 60188 and is currently estimated at $327,510, approximately $244 per square foot. 1298 Gloucester Cir is a home located in DuPage County with nearby schools including Spring Trail Elementary School, Eastview Middle School, and Bartlett High School.
Ownership History
Date
Name
Owned For
Owner Type
Purchase Details
Closed on
Mar 26, 1999
Sold by
Kalck Ronald F and Kalck Lisa A
Bought by
Manalang Mary Ann
Current Estimated Value
Home Financials for this Owner
Home Financials are based on the most recent Mortgage that was taken out on this home.
Original Mortgage
$137,061
Outstanding Balance
$34,273
Interest Rate
6.89%
Mortgage Type
FHA
Estimated Equity
$293,237
Purchase Details
Closed on
Mar 14, 1996
Sold by
Loiacono Daniel F and Dacko Loiacono Marie L
Bought by
Kalck Ronald F and Scorzo Lisa A
Home Financials for this Owner
Home Financials are based on the most recent Mortgage that was taken out on this home.
Original Mortgage
$101,200
Interest Rate
7.06%
Mortgage Type
Balloon
Create a Home Valuation Report for This Property
The Home Valuation Report is an in-depth analysis detailing your home's value as well as a comparison with similar homes in the area
Home Values in the Area
Average Home Value in this Area
Purchase History
| Date | Buyer | Sale Price | Title Company |
|---|---|---|---|
| Manalang Mary Ann | $141,500 | Fox Title Company | |
| Kalck Ronald F | $126,500 | West Counties Title Services |
Source: Public Records
Mortgage History
| Date | Status | Borrower | Loan Amount |
|---|---|---|---|
| Open | Manalang Mary Ann | $137,061 | |
| Previous Owner | Kalck Ronald F | $101,200 |
Source: Public Records
Tax History
| Year | Tax Paid | Tax Assessment Tax Assessment Total Assessment is a certain percentage of the fair market value that is determined by local assessors to be the total taxable value of land and additions on the property. | Land | Improvement |
|---|---|---|---|---|
| 2024 | $5,892 | $84,859 | $13,921 | $70,938 |
| 2023 | $5,402 | $76,990 | $12,630 | $64,360 |
| 2022 | $5,284 | $69,800 | $11,450 | $58,350 |
| 2021 | $5,097 | $66,260 | $10,870 | $55,390 |
| 2020 | $4,946 | $64,270 | $10,540 | $53,730 |
| 2019 | $4,868 | $61,970 | $10,160 | $51,810 |
| 2018 | $4,629 | $59,300 | $9,720 | $49,580 |
| 2017 | $4,528 | $56,930 | $9,330 | $47,600 |
| 2016 | $4,441 | $54,380 | $8,910 | $45,470 |
| 2015 | $4,465 | $51,470 | $8,430 | $43,040 |
| 2014 | $4,295 | $51,720 | $8,470 | $43,250 |
| 2013 | $5,122 | $52,960 | $8,670 | $44,290 |
Source: Public Records
Map
Nearby Homes
- 1266 Seabury Cir
- 1325 Gloucester Cir
- 1239 Spring Valley Dr
- 1328 Big Horn Trail
- 1308 Coldspring Rd Unit 7
- 2065 Millpond Ln
- 1215 Robin Dr
- 2198 Wildwood Ln
- 1874 Windward Ln
- 422 Cromwell Cir Unit 2
- 403 Cromwell Cir Unit 2
- 1823 Whaler Ln
- 3945 County Farm Rd
- 2325 Bayside Dr
- 264 Norway Ct
- 3758 Merrimac Ln W
- 1901 Pastoral Ln
- 1360 Rose Ave
- 1179 Edington Ct
- 1418 Merrimac Ln S
- 1296 Gloucester Cir
- 1294 Gloucester Cir
- 1297 Woodlake Dr Unit 1
- 1302 Gloucester Cir Unit 1302
- 1299 Woodlake Dr
- 1295 Woodlake Dr
- 1290 Gloucester Cir
- 1293 Woodlake Dr Unit 1
- 1301 Woodlake Dr
- 1291 Woodlake Dr
- 1304 Gloucester Cir Unit 1
- 1305 Woodlake Dr
- 1306 Gloucester Cir Unit 1
- 1299 Gloucester Cir
- 1297 Gloucester Cir
- 1295 Gloucester Cir
- 1301 Gloucester Cir
- 1309 Woodlake Dr
- 1308 Gloucester Cir
- 1291 Gloucester Cir
Your Personal Tour Guide
Ask me questions while you tour the home.