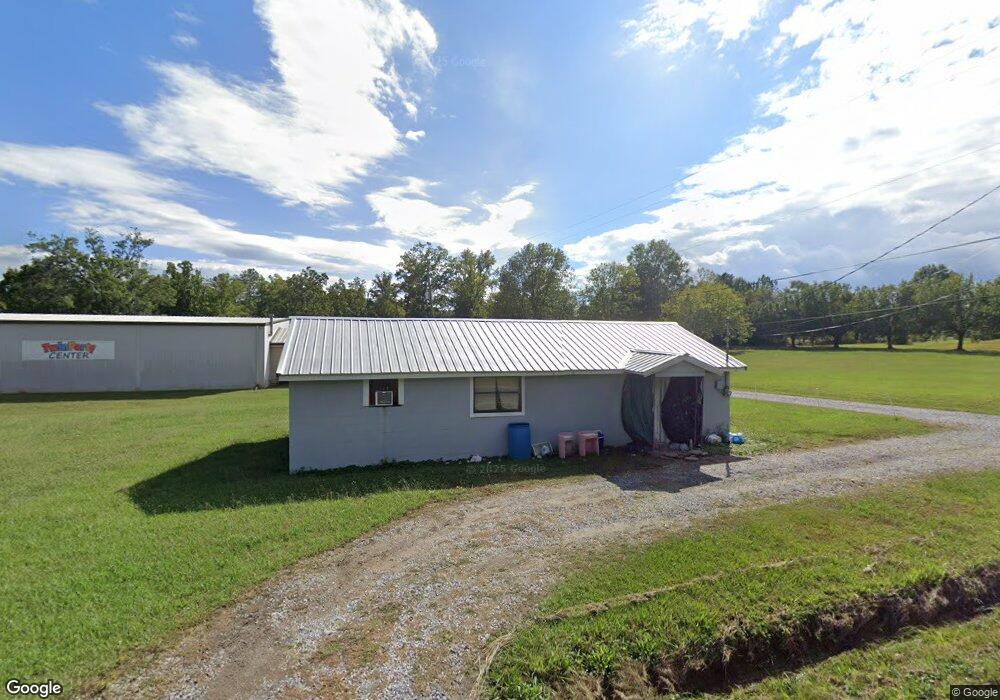
1298 Leonard Bridge Rd Chatsworth, GA 30705
Estimated Value: $81,312 - $170,000
--
Bed
1
Bath
680
Sq Ft
$174/Sq Ft
Est. Value
About This Home
This home is located at 1298 Leonard Bridge Rd, Chatsworth, GA 30705 and is currently estimated at $118,578, approximately $174 per square foot. 1298 Leonard Bridge Rd is a home located in Murray County with nearby schools including Coker Elementary School, Gladden Middle School, and Murray County High School.
Ownership History
Date
Name
Owned For
Owner Type
Purchase Details
Closed on
Apr 16, 2014
Sold by
Reed Dale
Bought by
Randall
Current Estimated Value
Purchase Details
Closed on
Jul 2, 2013
Sold by
Murray County Tax Commissi
Bought by
Reed Dale
Purchase Details
Closed on
Oct 5, 2007
Sold by
Vestal L
Bought by
Terry and Vestal
Home Financials for this Owner
Home Financials are based on the most recent Mortgage that was taken out on this home.
Original Mortgage
$23,335
Interest Rate
6.26%
Mortgage Type
New Conventional
Purchase Details
Closed on
Aug 8, 2007
Sold by
Not Provided
Bought by
Randall
Home Financials for this Owner
Home Financials are based on the most recent Mortgage that was taken out on this home.
Original Mortgage
$23,335
Interest Rate
6.26%
Mortgage Type
New Conventional
Purchase Details
Closed on
May 29, 1998
Sold by
Associates Financial
Bought by
Greeson Hugh
Purchase Details
Closed on
May 5, 1998
Sold by
Land Joan Kisselburg
Bought by
Associates Financial
Create a Home Valuation Report for This Property
The Home Valuation Report is an in-depth analysis detailing your home's value as well as a comparison with similar homes in the area
Home Values in the Area
Average Home Value in this Area
Purchase History
| Date | Buyer | Sale Price | Title Company |
|---|---|---|---|
| Randall | $2,529 | -- | |
| Reed Dale | -- | -- | |
| Terry | -- | -- | |
| Randall | $25,000 | -- | |
| Greeson Hugh | $15,000 | -- | |
| Associates Financial | $35,900 | -- |
Source: Public Records
Mortgage History
| Date | Status | Borrower | Loan Amount |
|---|---|---|---|
| Previous Owner | Terry | $23,335 |
Source: Public Records
Tax History Compared to Growth
Tax History
| Year | Tax Paid | Tax Assessment Tax Assessment Total Assessment is a certain percentage of the fair market value that is determined by local assessors to be the total taxable value of land and additions on the property. | Land | Improvement |
|---|---|---|---|---|
| 2024 | $339 | $14,400 | $2,960 | $11,440 |
| 2023 | $392 | $16,360 | $2,960 | $13,400 |
| 2022 | $347 | $14,480 | $2,840 | $11,640 |
| 2021 | $302 | $12,280 | $2,840 | $9,440 |
| 2020 | $260 | $10,560 | $2,680 | $7,880 |
| 2019 | $261 | $10,560 | $2,680 | $7,880 |
| 2018 | $261 | $10,560 | $2,680 | $7,880 |
| 2017 | $0 | $8,920 | $2,520 | $6,400 |
| 2016 | $210 | $9,240 | $3,080 | $6,160 |
| 2015 | -- | $9,240 | $3,080 | $6,160 |
| 2014 | -- | $9,240 | $3,080 | $6,160 |
| 2013 | -- | $9,240 | $3,080 | $6,160 |
Source: Public Records
Map
Nearby Homes
- 274 R & J St
- 110 Sitton Rd S
- 222 Old Wilson Rd
- 0 Highway 52 Unit 417342
- 0 Highway 52 Unit 1516971
- 0 Highway 52 Unit 10573726
- 0 Highway 52 Unit 415667
- 64 Barron Ct
- 219 Lakeview Dr
- 126 Charles Rd
- 124 School St
- 8 Maddox Ln
- 24 Maddox Ln
- 0 Hwy 411s Unit 123561
- lot B Elm St
- 2010 Old Dalton Ellijay Rd
- 37 Leonard Bridge Rd
- 91 Denise Dr
- 104 Denise Dr
- 79 Denise Dr
- 1269 Leonard Bridge Rd
- 1325 Leonard Bridge Rd
- 1252 Leonard Bridge Rd
- 1252 Leonard Bridge Rd
- 1330 Leonard Bridge Rd
- 1226 Leonard Bridge Rd
- 1308 Leonard Bridge Rd
- 1194 Leonard Bridge Rd
- 1379 Leonard Bridge Rd
- 1207F Davenport Dr
- 1199 Davenport Dr
- 1443 Leonard Bridge Rd
- 1400 Leonard Bridge Rd
- 1450 Leonard Bridge Rd
- 1110 Leonard Bridge Rd
- 80 Pate Rd
- 1392 Leonard Bridge Rd
- 1332 Leonard Bridge Rd
- 1509 Leonard Bridge Rd