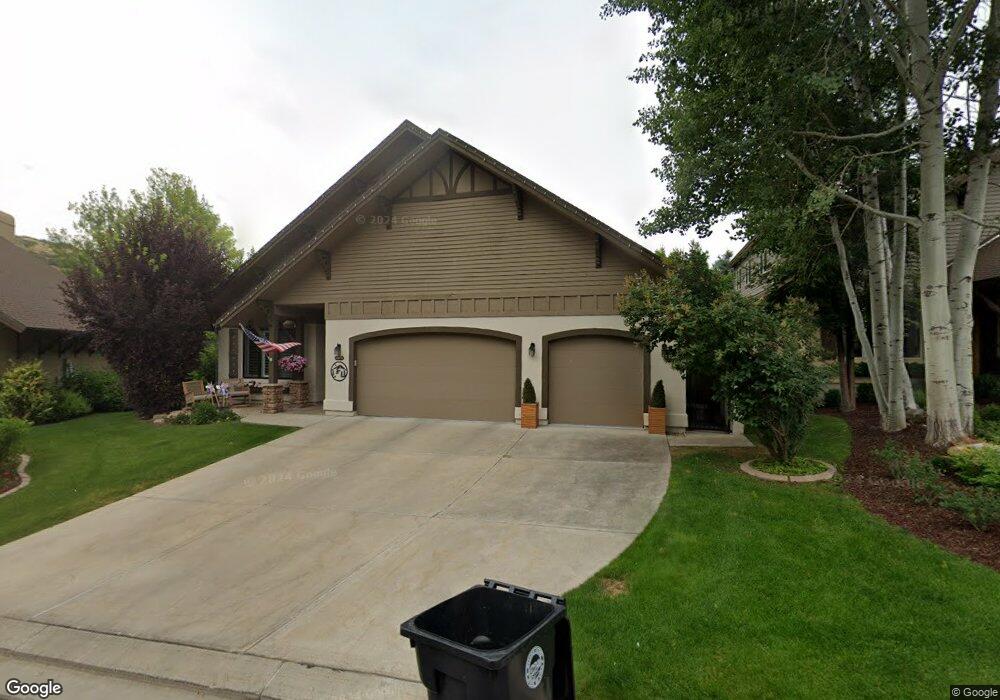
1298 Valais Cir Midway, UT 84049
Estimated Value: $1,564,000 - $2,018,941
--
Bed
--
Bath
3,497
Sq Ft
$527/Sq Ft
Est. Value
About This Home
This home is located at 1298 Valais Cir, Midway, UT 84049 and is currently estimated at $1,841,985, approximately $526 per square foot. 1298 Valais Cir is a home located in Wasatch County with nearby schools including Midway Elementary School, Rocky Mountain Middle School, and Wasatch High School.
Ownership History
Date
Name
Owned For
Owner Type
Purchase Details
Closed on
Sep 28, 2021
Sold by
Lloyd Bryan W and Lloyd Patricia A
Bought by
Lloyd Bryan W and Lloyd Patricia Ann
Current Estimated Value
Purchase Details
Closed on
Feb 20, 2018
Sold by
Hines Richard A and Hines Brenda K
Bought by
Lloyd Bryan W and Lloyd Patricia A
Home Financials for this Owner
Home Financials are based on the most recent Mortgage that was taken out on this home.
Original Mortgage
$453,100
Outstanding Balance
$258,984
Interest Rate
4.15%
Mortgage Type
New Conventional
Estimated Equity
$1,583,001
Purchase Details
Closed on
Sep 21, 2010
Sold by
Hines Richard A and Hines Brenda K
Bought by
Hines Richard A and Hines Brenda K
Create a Home Valuation Report for This Property
The Home Valuation Report is an in-depth analysis detailing your home's value as well as a comparison with similar homes in the area
Home Values in the Area
Average Home Value in this Area
Purchase History
| Date | Buyer | Sale Price | Title Company |
|---|---|---|---|
| Lloyd Bryan W | -- | None Available | |
| Lloyd Bryan W | -- | Us Title Insurance Agency | |
| Hines Richard A | -- | None Available |
Source: Public Records
Mortgage History
| Date | Status | Borrower | Loan Amount |
|---|---|---|---|
| Open | Lloyd Bryan W | $453,100 |
Source: Public Records
Tax History Compared to Growth
Tax History
| Year | Tax Paid | Tax Assessment Tax Assessment Total Assessment is a certain percentage of the fair market value that is determined by local assessors to be the total taxable value of land and additions on the property. | Land | Improvement |
|---|---|---|---|---|
| 2025 | $8,826 | $1,741,500 | $275,000 | $1,466,500 |
| 2024 | $9,760 | $1,947,578 | $275,000 | $1,672,578 |
| 2023 | $9,760 | $1,759,300 | $250,000 | $1,509,300 |
| 2022 | $9,702 | $1,759,300 | $250,000 | $1,509,300 |
| 2021 | $5,628 | $788,600 | $141,750 | $646,850 |
| 2020 | $5,804 | $788,600 | $141,750 | $646,850 |
| 2019 | $5,308 | $433,731 | $0 | $0 |
| 2018 | $4,557 | $372,317 | $0 | $0 |
| 2017 | $4,118 | $334,472 | $0 | $0 |
| 2016 | $3,979 | $315,222 | $0 | $0 |
| 2015 | $3,781 | $315,222 | $0 | $0 |
| 2014 | $3,934 | $315,222 | $0 | $0 |
Source: Public Records
Map
Nearby Homes
- 1336 N Antibe Ln
- 1336 Antibe Ln
- 49 W Oberland Ct
- 92 W Village Ct
- 1182 N Canyon View Rd Unit 11
- 1182 N Canyon View Rd
- 1119 Matterhorn Ct
- 1097 Matterhorn Ct
- 1070 Interlaken Dr
- 35 W Burgi Ln
- 1126 Springer View Loop
- 1128 N Springer View Loop
- 1441 N Jerry Gertsch Ln
- 752 N Wellness Dr Unit 25
- 1633 N Cambridge Dr Unit 11
- 1615 N Cambridge Dr Unit 9
- 1625 N Cambridge Dr Unit 10
- 1636 N Cambridge Dr Unit 13
- 363 W 1150 N
- 1298 N Valais Cir
- 1298 N Valais Cir Unit 82
- 1312 N Valais Cir
- 1312 N Valais Cir
- 1278 N Valais Cir
- 1288 Valais Cir
- 1278 Valais Cir
- 1297 Valais Cir
- 1268 Valais Cir
- 1285 Valais Cir
- 1324 Antibe Ln
- 1277 N Valais Cir
- 1277 Valais Cir
- 1328 Antibe Ln
- 102 E Innsbruck Ln
- 102 E Innsbruck Ln
- 1340 N Chancey Ln
- 1340 N Chancey Ln
- 1340 Chancey Ln
- 26 W Oberland Ct