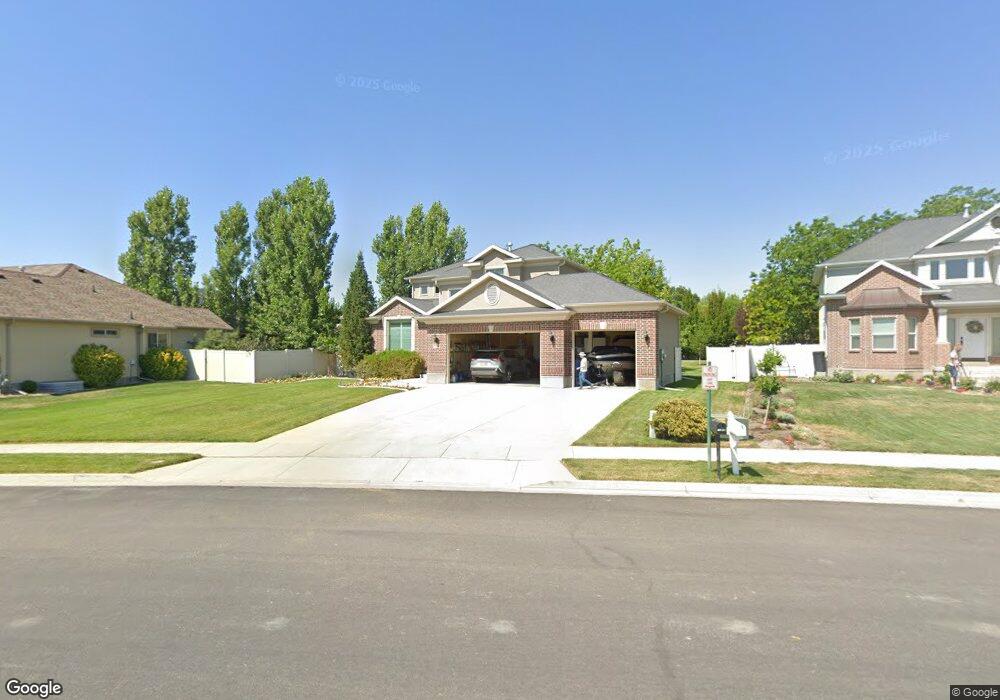
12982 Riverton Farms Way Riverton, UT 84065
Estimated Value: $812,000 - $930,000
5
Beds
4
Baths
2,404
Sq Ft
$351/Sq Ft
Est. Value
About This Home
This home is located at 12982 Riverton Farms Way, Riverton, UT 84065 and is currently estimated at $844,714, approximately $351 per square foot. 12982 Riverton Farms Way is a home located in Salt Lake County with nearby schools including Southland Elementary School, Oquirrh Hills Middle School, and Riverton High School.
Ownership History
Date
Name
Owned For
Owner Type
Purchase Details
Closed on
Oct 12, 2011
Sold by
Karpowitz James Frank and Karpowitz Nancy Elaine
Bought by
Karpowitz James Frank and Karpowitz Nancy Elaine
Current Estimated Value
Home Financials for this Owner
Home Financials are based on the most recent Mortgage that was taken out on this home.
Original Mortgage
$199,140
Outstanding Balance
$17,953
Interest Rate
3.34%
Mortgage Type
New Conventional
Estimated Equity
$826,761
Purchase Details
Closed on
Jul 3, 2008
Sold by
Karpowitz James F and Karpowitz Nancy E
Bought by
Karpowitz James Frank and Karpowitz Nancy Elaine
Purchase Details
Closed on
Jul 21, 2005
Sold by
Ivory Homes Ltd
Bought by
Karpowitz James F and Karpowitz Nancy E
Home Financials for this Owner
Home Financials are based on the most recent Mortgage that was taken out on this home.
Original Mortgage
$256,200
Interest Rate
5.51%
Mortgage Type
New Conventional
Create a Home Valuation Report for This Property
The Home Valuation Report is an in-depth analysis detailing your home's value as well as a comparison with similar homes in the area
Home Values in the Area
Average Home Value in this Area
Purchase History
| Date | Buyer | Sale Price | Title Company |
|---|---|---|---|
| Karpowitz James Frank | -- | American Preferred Title Slc | |
| Karpowitz James Frank | -- | American Preferred Title Slc | |
| Karpowitz James Frank | -- | None Available | |
| Karpowitz James F | -- | Cottonwood Title Ins Agency |
Source: Public Records
Mortgage History
| Date | Status | Borrower | Loan Amount |
|---|---|---|---|
| Open | Karpowitz James Frank | $199,140 | |
| Closed | Karpowitz James F | $256,200 |
Source: Public Records
Tax History Compared to Growth
Tax History
| Year | Tax Paid | Tax Assessment Tax Assessment Total Assessment is a certain percentage of the fair market value that is determined by local assessors to be the total taxable value of land and additions on the property. | Land | Improvement |
|---|---|---|---|---|
| 2025 | $4,363 | $786,800 | $236,900 | $549,900 |
| 2024 | $4,363 | $755,100 | $226,800 | $528,300 |
| 2023 | $4,418 | $720,800 | $222,400 | $498,400 |
| 2022 | $4,603 | $736,800 | $218,000 | $518,800 |
| 2021 | $3,875 | $552,300 | $174,400 | $377,900 |
| 2020 | $3,683 | $489,400 | $174,400 | $315,000 |
| 2019 | $3,687 | $481,600 | $140,600 | $341,000 |
| 2018 | $3,507 | $451,000 | $137,300 | $313,700 |
| 2017 | $3,428 | $429,700 | $137,300 | $292,400 |
| 2016 | $3,424 | $411,800 | $137,300 | $274,500 |
| 2015 | $3,335 | $388,800 | $136,000 | $252,800 |
| 2014 | $3,199 | $365,700 | $129,500 | $236,200 |
Source: Public Records
Map
Nearby Homes
- 3277 W 13120 S
- 12906 Verona Creek Way
- 13283 S Lucky Dog Ln
- 2249 W 13035 S
- 12580 S Janice Dr
- 13160 S Meadow Way
- 12900 S 2200 W
- 12501 Falls Creek Rd
- 3428 W Chatel Dr
- 2356 W Montcalm Dr
- 2036 W 13035 S
- 2106 W 13220 S
- 2048 W 12920 S
- 13596 S 2260 W
- 12243 Janice Dr
- 2853 W 12075 S
- 12191 S 3600 W
- 13667 S 3870 W
- 13959 S 2200 W
- 1814 W Dalmeny Way
- 12982 S Riverton Farms Way
- 12976 Riverton Farms Way
- 12992 Riverton Farms Way
- 12992 S Riverton Farms Way
- 12969 Prairie Hill Cir
- 12969 S Prairie Hill Cir
- 12956 Riverton Farms Way
- 2938 W 13010 S
- 12977 Prairie Hill Cir
- 12977 S Prairie Hill Cir
- 12938 Riverton Farms Way
- 2958 W 13010 S
- 2916 W 13010 S
- 12957 Prairie Hill Cir
- 2966 W 13010 S
- 12978 S Prairie Hill Cir
- 12978 Prairie Hill Cir
- 13037 S 2950 W
- 2978 W 13010 S
- 13038 S 2900 W