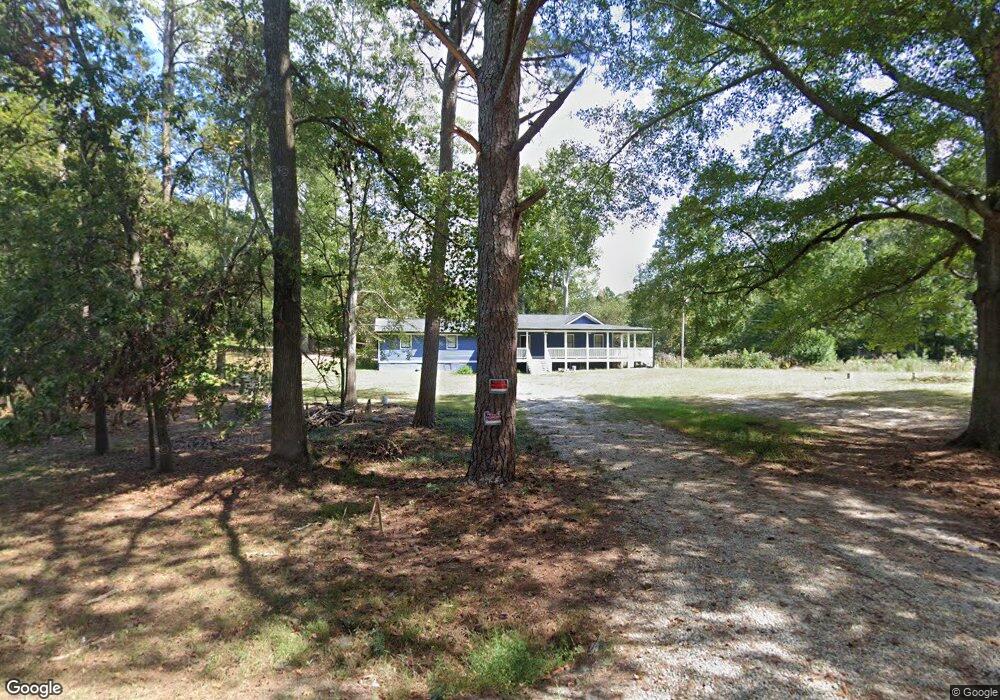
1299 Evans Rd Hoschton, GA 30548
Estimated Value: $383,000 - $417,000
3
Beds
3
Baths
1,760
Sq Ft
$228/Sq Ft
Est. Value
About This Home
This home is located at 1299 Evans Rd, Hoschton, GA 30548 and is currently estimated at $401,956, approximately $228 per square foot. 1299 Evans Rd is a home located in Barrow County with nearby schools including Bramlett Elementary School, Russell Middle School, and Winder-Barrow High School.
Ownership History
Date
Name
Owned For
Owner Type
Purchase Details
Closed on
Aug 18, 2021
Sold by
Newport Lodging Investment Group Inc
Bought by
Lopez Valentin Garcia and Chilel Maudilia Juarez
Current Estimated Value
Purchase Details
Closed on
Sep 10, 2004
Sold by
Whited Rick and Whited Gail
Bought by
Newport Lodging Inv Grp Inc
Home Financials for this Owner
Home Financials are based on the most recent Mortgage that was taken out on this home.
Original Mortgage
$164,000
Interest Rate
6.01%
Mortgage Type
New Conventional
Purchase Details
Closed on
Sep 9, 2004
Sold by
Dockery Kathy Griffeth
Bought by
Dockery Kathy Griffeth
Home Financials for this Owner
Home Financials are based on the most recent Mortgage that was taken out on this home.
Original Mortgage
$164,000
Interest Rate
6.01%
Mortgage Type
New Conventional
Purchase Details
Closed on
Dec 4, 2000
Sold by
Dockery Glenn Nelson
Bought by
Dockery Kathy Griffe
Create a Home Valuation Report for This Property
The Home Valuation Report is an in-depth analysis detailing your home's value as well as a comparison with similar homes in the area
Home Values in the Area
Average Home Value in this Area
Purchase History
| Date | Buyer | Sale Price | Title Company |
|---|---|---|---|
| Lopez Valentin Garcia | $294,000 | -- | |
| Newport Lodging Inv Grp Inc | $145,000 | -- | |
| Newport Lodging Inv Grp Inc | $205,000 | -- | |
| Dockery Kathy Griffeth | -- | -- | |
| Dockery Kathy Griffe | -- | -- |
Source: Public Records
Mortgage History
| Date | Status | Borrower | Loan Amount |
|---|---|---|---|
| Previous Owner | Newport Lodging Inv Grp Inc | $164,000 |
Source: Public Records
Tax History Compared to Growth
Tax History
| Year | Tax Paid | Tax Assessment Tax Assessment Total Assessment is a certain percentage of the fair market value that is determined by local assessors to be the total taxable value of land and additions on the property. | Land | Improvement |
|---|---|---|---|---|
| 2024 | $2,829 | $114,900 | $44,785 | $70,115 |
| 2023 | $2,813 | $114,900 | $44,785 | $70,115 |
| 2022 | $2,442 | $85,566 | $44,785 | $40,781 |
| 2021 | $1,715 | $56,389 | $35,828 | $20,561 |
| 2020 | $1,161 | $37,661 | $17,100 | $20,561 |
| 2019 | $1,126 | $35,828 | $17,100 | $18,728 |
| 2018 | $1,108 | $35,828 | $17,100 | $18,728 |
| 2017 | $985 | $33,833 | $17,100 | $16,733 |
| 2016 | $1,047 | $34,114 | $17,100 | $17,014 |
| 2015 | $1,124 | $42,948 | $24,500 | $18,448 |
| 2014 | $982 | $30,758 | $12,005 | $18,753 |
| 2013 | -- | $30,023 | $12,005 | $18,018 |
Source: Public Records
Map
Nearby Homes
- 4525 Legacy Ct
- 1376 Beringer Dr
- 951 Ardmore Tr
- 940 Chateau Forest Rd
- 4828 Ardmore Ln
- 1271 Harvest Ln
- 1011 Ardmore Trail
- 1431 Winding Ridge Trail
- 1203 Vintage Way
- 4727 Ardmore Ln
- 4728 Ardmore Ln
- 1841 Hidden Creek Dr
- 5747 Wheeler Rd
- 1543 Maston Rd
- 1576 Maston Rd
- 5689 Wheeler Ridge Rd
- 2711 Wildflower Way
- 29 Hydrangea Way Unit 72
- 1351 Ashbury Park Way E
- 1299 Evans Rd
- 1299 Evans Rd
- 1307 Evans Rd
- 0 Evans Rd Unit 8752672
- 1364 Highway 124
- 1289 Evans Rd
- 1271 Evans Rd
- 1339 Highway 124
- 1268 Evans Rd
- 1361 Highway 124
- 1265 Evans Rd
- 1345 Highway 124
- 1302 Merlot Ct
- 1296 Highway 124
- 1253 Evans Rd
- 1252 Evans Rd
- 1362 Beringer Dr Unit 2
- 1336 Highway 124
- 1300 Highway 124
- 1300 Merlot Ct