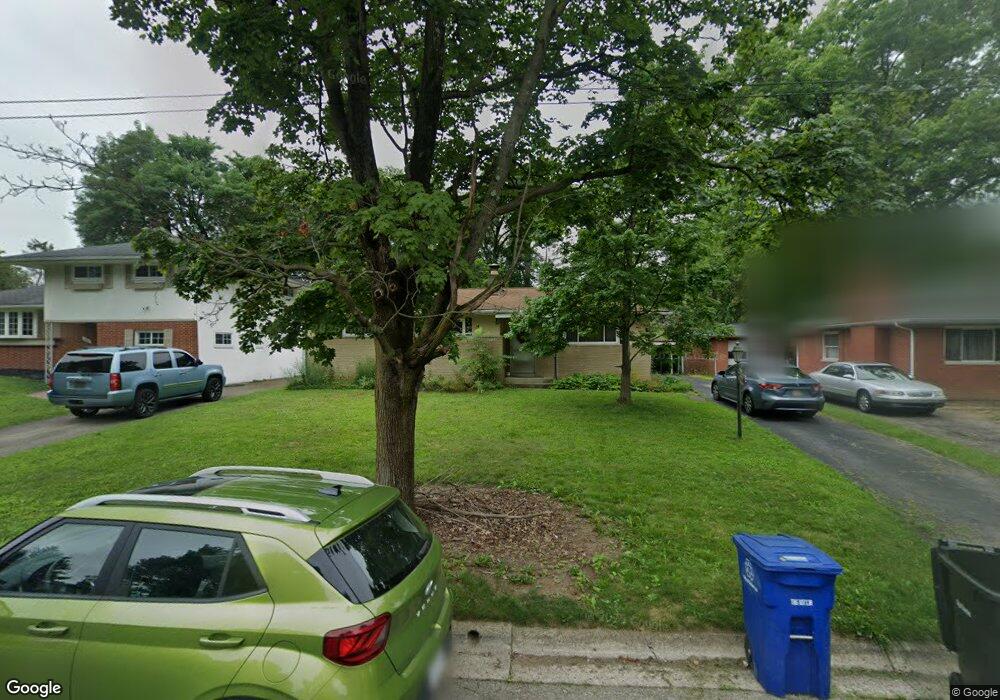
1299 Littlejohn Dr Columbus, OH 43227
Shady Lane NeighborhoodEstimated Value: $214,000 - $245,000
3
Beds
2
Baths
1,238
Sq Ft
$183/Sq Ft
Est. Value
About This Home
This home is located at 1299 Littlejohn Dr, Columbus, OH 43227 and is currently estimated at $226,408, approximately $182 per square foot. 1299 Littlejohn Dr is a home located in Franklin County with nearby schools including Shady Lane Elementary School, Sherwood Middle School, and Walnut Ridge High School.
Ownership History
Date
Name
Owned For
Owner Type
Purchase Details
Closed on
Mar 17, 2017
Sold by
Kertis Carl A and Vaive Kertis Melanie B
Bought by
Kertis Carl A
Current Estimated Value
Purchase Details
Closed on
Sep 18, 1997
Sold by
Knepp Robert E and Knepp Janet K
Bought by
Kertis Carl A and Vaive Kertis Melanie B
Home Financials for this Owner
Home Financials are based on the most recent Mortgage that was taken out on this home.
Original Mortgage
$76,000
Outstanding Balance
$11,944
Interest Rate
7.63%
Estimated Equity
$214,464
Purchase Details
Closed on
Mar 8, 1995
Sold by
Est Wilber M Martin
Bought by
Weaver Robert R Knepp and Weaver Janet M
Home Financials for this Owner
Home Financials are based on the most recent Mortgage that was taken out on this home.
Original Mortgage
$64,100
Interest Rate
9.13%
Mortgage Type
New Conventional
Create a Home Valuation Report for This Property
The Home Valuation Report is an in-depth analysis detailing your home's value as well as a comparison with similar homes in the area
Home Values in the Area
Average Home Value in this Area
Purchase History
| Date | Buyer | Sale Price | Title Company |
|---|---|---|---|
| Kertis Carl A | -- | None Available | |
| Kertis Carl A | $80,000 | -- | |
| Weaver Robert R Knepp | $67,500 | -- |
Source: Public Records
Mortgage History
| Date | Status | Borrower | Loan Amount |
|---|---|---|---|
| Open | Kertis Carl A | $76,000 | |
| Closed | Weaver Robert R Knepp | $64,100 |
Source: Public Records
Tax History Compared to Growth
Tax History
| Year | Tax Paid | Tax Assessment Tax Assessment Total Assessment is a certain percentage of the fair market value that is determined by local assessors to be the total taxable value of land and additions on the property. | Land | Improvement |
|---|---|---|---|---|
| 2024 | $2,823 | $62,900 | $18,380 | $44,520 |
| 2023 | $2,787 | $62,895 | $18,375 | $44,520 |
| 2022 | $1,841 | $35,490 | $6,300 | $29,190 |
| 2021 | $1,844 | $35,490 | $6,300 | $29,190 |
| 2020 | $1,846 | $35,490 | $6,300 | $29,190 |
| 2019 | $1,703 | $28,070 | $5,040 | $23,030 |
| 2018 | $1,666 | $28,070 | $5,040 | $23,030 |
| 2017 | $1,750 | $28,070 | $5,040 | $23,030 |
| 2016 | $1,799 | $27,160 | $5,460 | $21,700 |
| 2015 | $1,633 | $27,160 | $5,460 | $21,700 |
| 2014 | $1,637 | $27,160 | $5,460 | $21,700 |
| 2013 | $949 | $31,920 | $6,405 | $25,515 |
Source: Public Records
Map
Nearby Homes
- 1130 Little Plum Ln
- 4677 E Livingston Ave
- 1320 Nancy Ln
- 4501 Amesbury Rd
- 4484 Grimsby Rd
- 4571 Aragon Ave
- 1486 Efner Dr
- 1281 Maetzel Dr
- 4991 Justin Rd
- 1607 Shady Lane Rd
- 4467 Grimsby Rd
- 1563 Genoa Place
- 1607 Simpson Dr
- 4701 Janis Dr
- 1571 Baxter Dr
- 1678 Huxley Dr
- 1691 Shady Lane Rd
- 1085 S Hamilton Rd
- 1068 Ross Rd
- 1543 S Hamilton Rd
- 1307 Littlejohn Dr
- 1291 Littlejohn Dr
- 1315 Littlejohn Dr
- 0 Littlejohn Rd
- 4785 Robinhood Park
- 4777 Robinhood Park
- 0 Scarlet St
- 1302 Littlejohn Dr
- 1294 Littlejohn Dr
- 1310 Littlejohn Dr
- 1310 Littlejohn Dr Unit 1
- 4769 Robinhood Park
- 4762 Scarlet St
- 4774 Scarlet St
- 1286 Littlejohn Dr
- 1318 Littlejohn Dr
- 4761 Robinhood Park
- 4754 Scarlet St
- 1326 Littlejohn Dr
- 1276 Littlejohn Dr