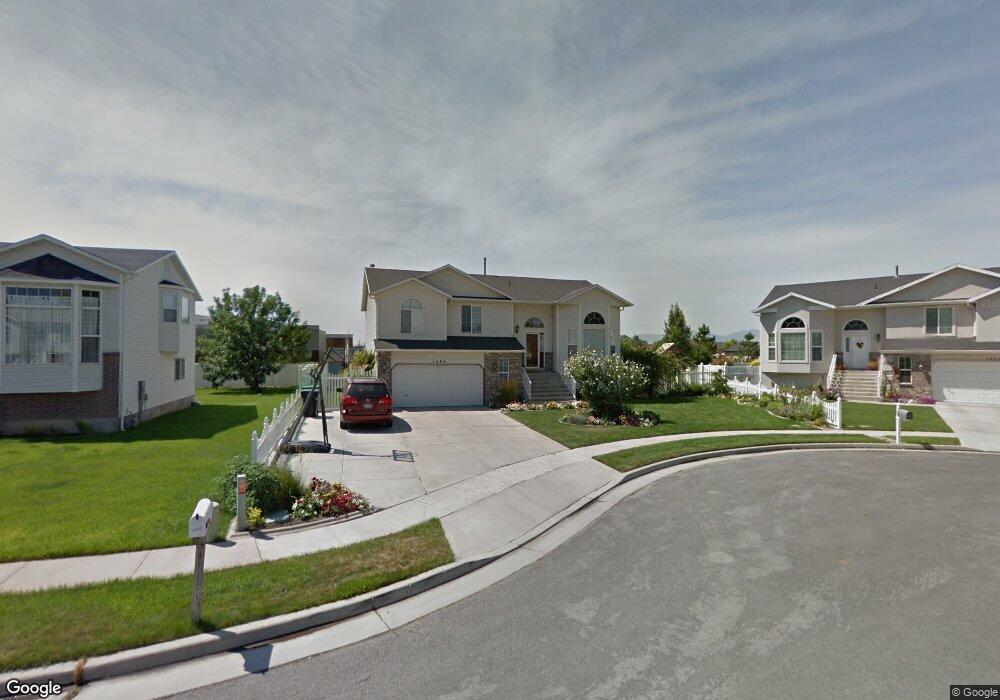
1299 W 2050 S Woods Cross, UT 84087
Estimated Value: $544,000 - $680,000
5
Beds
3
Baths
1,498
Sq Ft
$389/Sq Ft
Est. Value
About This Home
This home is located at 1299 W 2050 S, Woods Cross, UT 84087 and is currently estimated at $582,587, approximately $388 per square foot. 1299 W 2050 S is a home located in Davis County with nearby schools including Woods Cross Elementary School, South Davis Junior High School, and Woods Cross High School.
Ownership History
Date
Name
Owned For
Owner Type
Purchase Details
Closed on
Feb 8, 2017
Sold by
Kearsley Heidi and Kearsley Alan T
Bought by
Kearsley Alan T and Kearsley Heidi
Current Estimated Value
Home Financials for this Owner
Home Financials are based on the most recent Mortgage that was taken out on this home.
Original Mortgage
$20,000
Outstanding Balance
$16,575
Interest Rate
4.32%
Mortgage Type
New Conventional
Estimated Equity
$566,012
Purchase Details
Closed on
Aug 30, 2004
Sold by
Garfield David L and Garfield Barbara J
Bought by
Kearsley Alan T and Hearsley Heidi
Home Financials for this Owner
Home Financials are based on the most recent Mortgage that was taken out on this home.
Original Mortgage
$144,000
Outstanding Balance
$71,028
Interest Rate
5.92%
Mortgage Type
Purchase Money Mortgage
Estimated Equity
$511,559
Purchase Details
Closed on
Dec 22, 1998
Sold by
Woodside Homes Corp
Bought by
Garfield David L and Garfield Barbara J
Home Financials for this Owner
Home Financials are based on the most recent Mortgage that was taken out on this home.
Original Mortgage
$140,350
Interest Rate
6.91%
Create a Home Valuation Report for This Property
The Home Valuation Report is an in-depth analysis detailing your home's value as well as a comparison with similar homes in the area
Home Values in the Area
Average Home Value in this Area
Purchase History
| Date | Buyer | Sale Price | Title Company |
|---|---|---|---|
| Kearsley Alan T | -- | -- | |
| Kearsley Alan T | -- | Advanced Title Ins Agency Lc | |
| Garfield David L | -- | First American Title Co |
Source: Public Records
Mortgage History
| Date | Status | Borrower | Loan Amount |
|---|---|---|---|
| Open | Kearsley Alan T | $20,000 | |
| Open | Kearsley Alan T | $144,000 | |
| Previous Owner | Garfield David L | $140,350 | |
| Closed | Kearsley Alan T | $26,000 |
Source: Public Records
Tax History Compared to Growth
Tax History
| Year | Tax Paid | Tax Assessment Tax Assessment Total Assessment is a certain percentage of the fair market value that is determined by local assessors to be the total taxable value of land and additions on the property. | Land | Improvement |
|---|---|---|---|---|
| 2025 | $3,313 | $287,650 | $114,985 | $172,665 |
| 2024 | $3,135 | $277,750 | $123,270 | $154,480 |
| 2023 | $2,948 | $484,000 | $163,893 | $320,107 |
| 2022 | $3,011 | $275,000 | $71,194 | $203,806 |
| 2021 | $2,683 | $389,000 | $104,728 | $284,272 |
| 2020 | $2,395 | $343,000 | $99,760 | $243,240 |
| 2019 | $2,357 | $332,000 | $92,798 | $239,202 |
| 2018 | $2,202 | $307,000 | $91,196 | $215,804 |
| 2016 | $1,930 | $146,960 | $39,695 | $107,265 |
| 2015 | $1,940 | $142,340 | $39,695 | $102,645 |
| 2014 | $1,990 | $149,956 | $39,695 | $110,261 |
| 2013 | -- | $122,250 | $28,826 | $93,424 |
Source: Public Records
Map
Nearby Homes
- 1255 W 2050 S
- 1384 W 2175 S
- 1984 S 1500 W
- 1998 S 1600 W
- 2024 S 925 W
- 916 W 2025 S
- 913 W 2025 S
- 1334 W 1300 S
- 1422 W 1300 S
- 1309 W 1200 S
- 1288 S 1050 W
- 1623 S 925 W
- 1552 S 850 W
- 1137 S 1050 W
- 1846 W 2280 S
- 770 W 1900 S
- 1069 W Linden Ln Unit 31
- Swiss 2 - Urban Plan at The Audrey - theAUDREY
- Swiss 3 - Urban Plan at The Audrey - theAUDREY
- Swiss 1 - Cottage Plan at The Audrey - theAUDREY