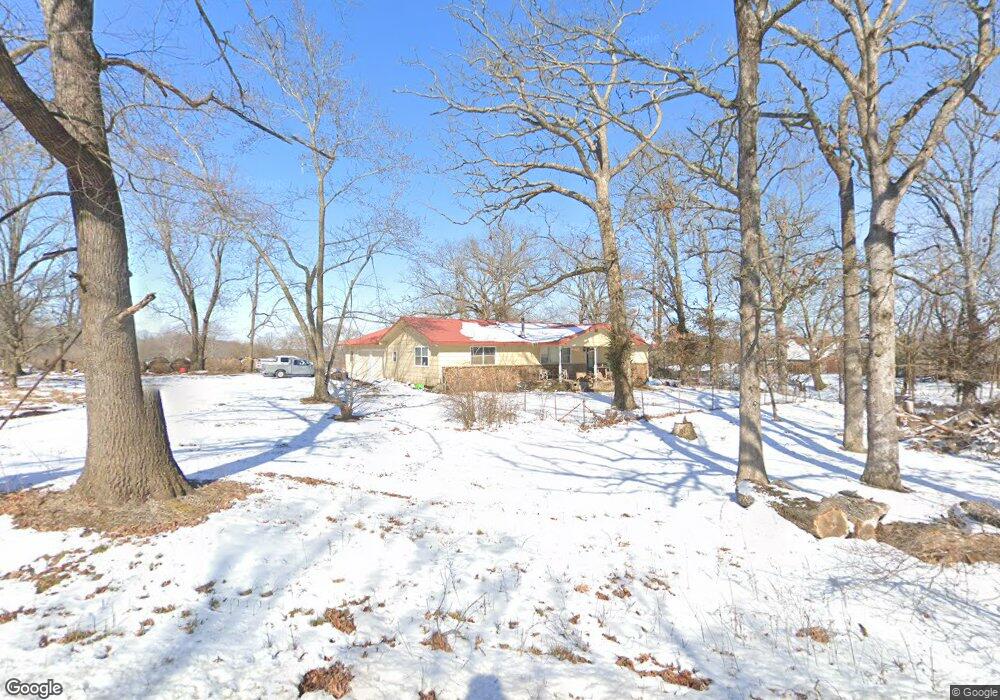
12992 E Tucks Chapel Rd Rogers, AR 72756
Estimated Value: $272,533 - $449,000
Studio
2
Baths
1,560
Sq Ft
$232/Sq Ft
Est. Value
About This Home
This home is located at 12992 E Tucks Chapel Rd, Rogers, AR 72756 and is currently estimated at $362,383, approximately $232 per square foot. 12992 E Tucks Chapel Rd is a home located in Benton County with nearby schools including Northside Elementary School, Lingle Middle School, and Rogers Heritage High School.
Ownership History
Date
Name
Owned For
Owner Type
Purchase Details
Closed on
Sep 30, 2004
Bought by
Council Fam Tr
Current Estimated Value
Purchase Details
Closed on
Jan 28, 1992
Bought by
Dod 01-28-1992
Purchase Details
Closed on
Mar 23, 1989
Bought by
Council Jim L and Council Barbara L
Purchase Details
Closed on
May 26, 1977
Bought by
Council Jimmy Lee
Create a Home Valuation Report for This Property
The Home Valuation Report is an in-depth analysis detailing your home's value as well as a comparison with similar homes in the area
Home Values in the Area
Average Home Value in this Area
Purchase History
| Date | Buyer | Sale Price | Title Company |
|---|---|---|---|
| Council Fam Tr | -- | -- | |
| Dod 01-28-1992 | -- | -- | |
| Council Jim L | -- | -- | |
| Council Jimmy Lee | -- | -- |
Source: Public Records
Tax History
| Year | Tax Paid | Tax Assessment Tax Assessment Total Assessment is a certain percentage of the fair market value that is determined by local assessors to be the total taxable value of land and additions on the property. | Land | Improvement |
|---|---|---|---|---|
| 2025 | $1,633 | $43,461 | $10,000 | $33,461 |
| 2024 | $1,411 | $43,461 | $10,000 | $33,461 |
| 2023 | $1,283 | $29,340 | $3,800 | $25,540 |
| 2022 | $1,423 | $29,340 | $3,800 | $25,540 |
| 2021 | $1,314 | $29,340 | $3,800 | $25,540 |
| 2020 | $1,209 | $20,520 | $1,500 | $19,020 |
| 2019 | $1,209 | $20,520 | $1,500 | $19,020 |
| 2018 | $859 | $20,520 | $1,500 | $19,020 |
| 2017 | $787 | $20,520 | $1,500 | $19,020 |
| 2016 | $787 | $20,520 | $1,500 | $19,020 |
| 2015 | $950 | $19,760 | $3,200 | $16,560 |
| 2014 | $750 | $19,760 | $3,200 | $16,560 |
Source: Public Records
Map
Nearby Homes
- 989 Red Cedar Place
- 949 Red Cedar Place
- 969 Rader Rd
- 13113 Scenic Dr
- 12509 W Tucks Chapel Rd
- 0 Rader Rd Unit 1290308
- 12878 Kellie Cir
- 12620 Lindy Ln
- 12437 Wildwood Dr
- 329 Rader Rd
- 12418 Wildwood Dr
- 11680 Amy Ave
- 12412 Wildwood Dr
- 12325 Cannon Rd
- 5116 Joe Ln
- 13585 Andy Jack Rd
- 150 N Highway 62
- 1300 Bunker Dr
- 1301 Bunker Dr
- 1229 Bunker Dr
- 13011 E Tucks Chapel Rd
- 13054 E Tucks Chapel Rd
- 12970 E Tucks Chapel Rd
- 12907 E Tucks Chapel Rd
- 12906 E Tucks Chapel Rd
- 12922 E Tucks Chapel Rd
- 13140 E Tucks Chapel Rd
- 13130 E Tucks Chapel Rd
- 13130 E Tucks Chapel Rd
- 13172 E Tucks Chapel Rd
- 12992 Willow Oak Ln
- 13178 E Tucks Chapel Rd
- Lot 14 W Timber Rd
- 12830 E Tucks Chapel Rd
- Lot 13 Red Cedar Place
- Lot 13 W Timber Rd
- 12193 Cemetery Rd
- 12806 E Tucks Chapel Rd
- 12818 E Tucks Chapel Rd
- Lot 15 W Timber Rd
Your Personal Tour Guide
Ask me questions while you tour the home.