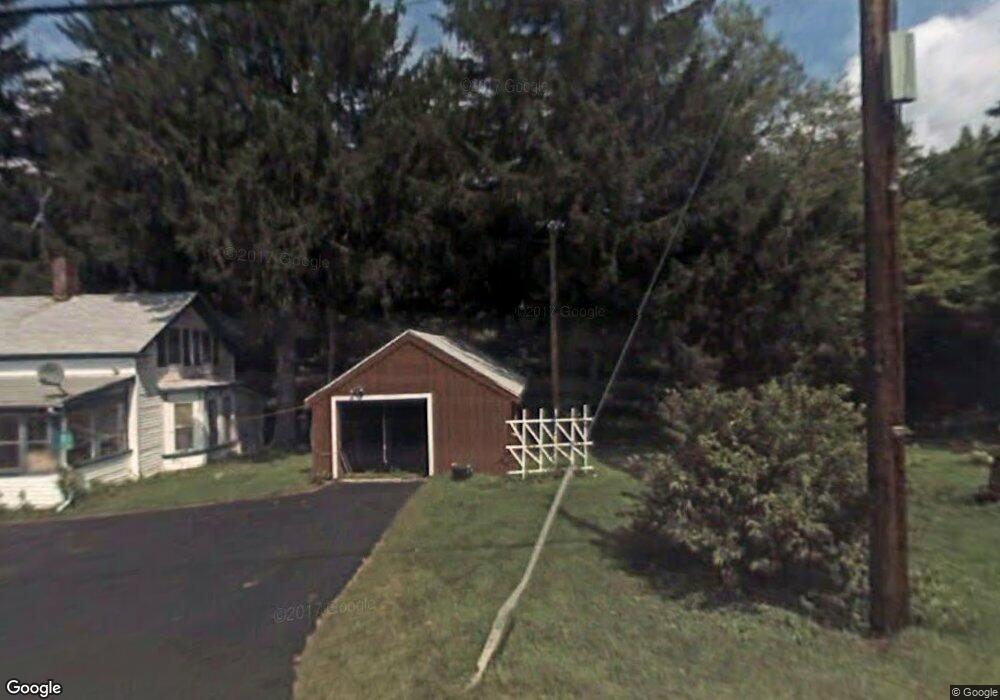
129B Main Rd Tyringham, MA 01264
Estimated Value: $432,000 - $677,000
About This Home
This home is located at 129B Main Rd, Tyringham, MA 01264 and is currently estimated at $522,241, approximately $306 per square foot. 129B Main Rd is a home located in Berkshire County with nearby schools including Lee Elementary School and Lee Middle/High School.
Ownership History
We collect this data history from publicly available records. To have your information removed, we recommend requesting removal directly through your county’s website.
Purchase Details
Purchase Details
Home Financials for this Owner
Home Financials are based on the most recent Mortgage that was taken out on this home.Purchase History
We collect this data history from publicly available records. To have your information removed, we recommend requesting removal directly through your county’s website.
| Date | Buyer | Sale Price | Title Company |
|---|---|---|---|
| -- | None Available | ||
| -- | None Available | ||
| $485,000 | None Available |
Mortgage History
We collect this data history from publicly available records. To have your information removed, we recommend requesting removal directly through your county’s website.
| Date | Status | Borrower | Loan Amount |
|---|---|---|---|
| Previous Owner | $160,000 |
Tax History
We collect this data history from publicly available records. To have your information removed, we recommend requesting removal directly through your county’s website.
| Year | Tax Paid | Tax Assessment Tax Assessment Total Assessment is a certain percentage of the fair market value that is determined by local assessors to be the total taxable value of land and additions on the property. | Land | Improvement |
|---|---|---|---|---|
| 2025 | $2,271 | $371,000 | $102,200 | $268,800 |
| 2024 | $2,202 | $351,700 | $99,300 | $252,400 |
| 2023 | $2,223 | $337,800 | $94,900 | $242,900 |
| 2022 | $2,005 | $298,300 | $94,900 | $203,400 |
| 2021 | $2,011 | $291,400 | $92,100 | $199,300 |
| 2020 | $2,031 | $290,600 | $92,100 | $198,500 |
| 2019 | $1,929 | $287,500 | $92,100 | $195,400 |
| 2018 | $2,002 | $287,600 | $92,100 | $195,500 |
| 2017 | $2,052 | $293,100 | $91,400 | $201,700 |
| 2016 | $1,965 | $291,500 | $91,400 | $200,100 |
| 2015 | $1,916 | $287,700 | $91,400 | $196,300 |
Map
- 0 Goose Pond (Lot #4) Rd Unit 249638
- 37 Main Rd
- 19 Lakeside Dr
- 230 Chanterwood Rd
- 8 Hemlock Rd
- 201 Chanterwood Rd
- 161 Beartown Mountain Rd
- 545 Leisure Lee Rd
- 140 Beartown Mountain Rd
- 130 Elk Dr
- 99 Beartown Mountain Rd
- Lot 15 Dimmock Rd
- 169 Mount Hunger Rd
- 289 Antelope Dr
- 0 Jacobs Ladder Rd Unit 249333
- 0 Jacobs Ladder Rd Unit 45
- 0 Jacobs Ladder Rd Unit 27595846
- 800 Cape St
- 465 Chapel St
- 555 Marble St
Ask me questions while you tour the home.