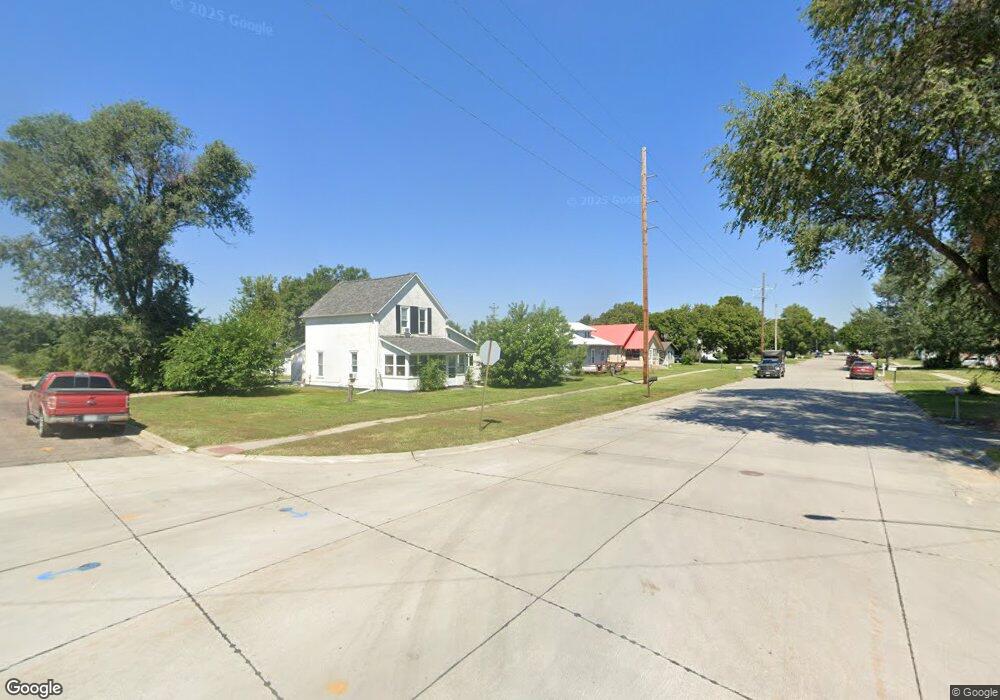
12O N Osborne St Ainsworth, NE 69210
Estimated Value: $71,000 - $124,000
2
Beds
1
Bath
1,028
Sq Ft
$95/Sq Ft
Est. Value
About This Home
This home is located at 12O N Osborne St, Ainsworth, NE 69210 and is currently estimated at $97,615, approximately $94 per square foot. 12O N Osborne St is a home with nearby schools including Ainsworth Elementary School, Ainsworth Middle School, and Ainsworth High School.
Ownership History
Date
Name
Owned For
Owner Type
Purchase Details
Closed on
Jul 9, 2024
Sold by
Burdick Richard E
Bought by
Harder Sophia E
Current Estimated Value
Home Financials for this Owner
Home Financials are based on the most recent Mortgage that was taken out on this home.
Original Mortgage
$101,000
Outstanding Balance
$99,782
Interest Rate
6.94%
Mortgage Type
New Conventional
Estimated Equity
-$2,167
Purchase Details
Closed on
Aug 14, 2023
Sold by
Lentz Daniel J and Lentz Alane M
Bought by
Burdick Richard E
Purchase Details
Closed on
Aug 25, 2022
Sold by
Lentz Matthew J and Lentz Jenifer L
Bought by
Lentz Daniel J and Lentz Alane M
Purchase Details
Closed on
Jun 12, 2012
Sold by
Woods Carol A and Marsh James M
Bought by
Lentz Matthew J
Purchase Details
Closed on
Jan 29, 2010
Sold by
Bassett Andrew
Bought by
Woods Carol A
Purchase Details
Closed on
Feb 22, 2008
Sold by
Beebout Merlin F and Beebout Jeree J
Bought by
Evans Brandon L and Evans Amanda S
Create a Home Valuation Report for This Property
The Home Valuation Report is an in-depth analysis detailing your home's value as well as a comparison with similar homes in the area
Home Values in the Area
Average Home Value in this Area
Purchase History
| Date | Buyer | Sale Price | Title Company |
|---|---|---|---|
| Harder Sophia E | $111,000 | None Listed On Document | |
| Burdick Richard E | $90,000 | None Listed On Document | |
| Lentz Daniel J | $45,000 | None Listed On Document | |
| Lentz Matthew J | $12,500 | -- | |
| Woods Carol A | -- | -- | |
| Woods Carol A | -- | -- | |
| Evans Brandon L | $14,000 | -- | |
| Evans Brandon L | $14,000 | -- |
Source: Public Records
Mortgage History
| Date | Status | Borrower | Loan Amount |
|---|---|---|---|
| Open | Harder Sophia E | $101,000 |
Source: Public Records
Tax History Compared to Growth
Tax History
| Year | Tax Paid | Tax Assessment Tax Assessment Total Assessment is a certain percentage of the fair market value that is determined by local assessors to be the total taxable value of land and additions on the property. | Land | Improvement |
|---|---|---|---|---|
| 2024 | $758 | $56,769 | $11,025 | $45,744 |
| 2023 | $753 | $47,885 | $6,300 | $41,585 |
| 2022 | $602 | $40,120 | $6,300 | $33,820 |
| 2021 | $642 | $40,120 | $6,300 | $33,820 |
| 2020 | $664 | $39,760 | $6,300 | $33,460 |
| 2019 | $642 | $39,470 | $6,300 | $33,170 |
| 2018 | $353 | $22,254 | $4,500 | $17,754 |
| 2017 | $355 | $20,640 | $4,500 | $16,140 |
| 2016 | $355 | $20,640 | $4,500 | $16,140 |
| 2015 | $236 | $12,456 | $4,050 | $8,406 |
| 2014 | $254 | $12,456 | $4,050 | $8,406 |
Source: Public Records
Map
Nearby Homes
- 142 W South St
- 409 N Wilson St
- 325 S Maple St
- 135 N Elm St
- 144 W 6th St
- 602 N Osborne St
- 0 Ainsworth Acreage Unit 11568974
- Ainsworth Unit NE 69210
- 632 N Oak St
- 829 E 1st St
- 86371 Nebraska 7
- 1 Old Highway 7
- 136 N Park St
- Ainsworth Unit NE 69210
- 87480 State Hwy 7 Unit Ainsworth NE 69210
- 87480 Nebraska 7
- Ainsworth Unit NE 69210
- Ainsworth Unit NE 69210
- 5.03
- Long Pine Unit NE 69217
- 130 N Osborne St
- 140 N Osborne St
- 110 N Osborne St
- 246 W 1st St
- 120 N Osborne St
- 115 N Osborne St
- 127 N Osborne St
- 107 N Osborne St
- 100 Woodward
- 135 N Osborne St
- 104 N Woodward St
- 220 N Osborne St
- 205 N Osborne St
- 105 S Osborne St
- 338 W 1st St
- 221 N Osborne St
- 329 W 2nd St
- 341 W 2nd St
- 240 N Osborne St
- 334 W 2nd St