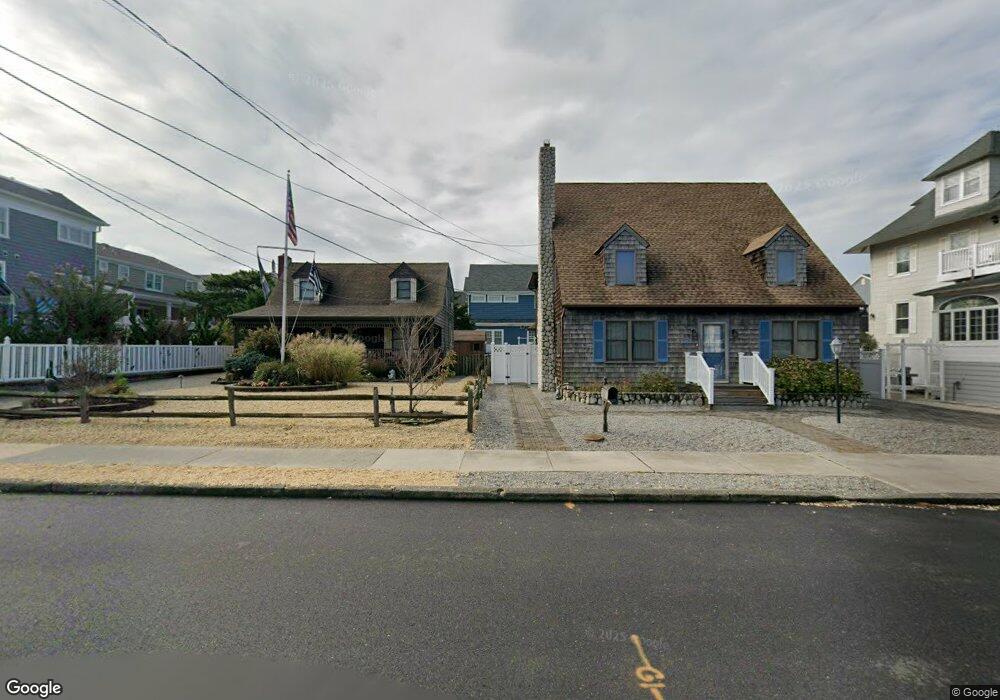
13 3rd Ave Seaside Park, NJ 08752
Estimated Value: $545,000 - $693,000
2
Beds
2
Baths
860
Sq Ft
$702/Sq Ft
Est. Value
About This Home
This home is located at 13 3rd Ave, Seaside Park, NJ 08752 and is currently estimated at $603,309, approximately $701 per square foot. 13 3rd Ave is a home located in Ocean County with nearby schools including Central Regional Middle School and Central Regional High School.
Ownership History
Date
Name
Owned For
Owner Type
Purchase Details
Closed on
Oct 14, 2020
Sold by
Sammarro Michael and Sammarro Patricia
Bought by
Nigro Antonio and Nigro Jacqueline
Current Estimated Value
Home Financials for this Owner
Home Financials are based on the most recent Mortgage that was taken out on this home.
Original Mortgage
$270,000
Interest Rate
2.8%
Mortgage Type
New Conventional
Purchase Details
Closed on
May 17, 1995
Sold by
Midway East In
Bought by
Sammarro Michael and Sammarro Patricia Ann
Create a Home Valuation Report for This Property
The Home Valuation Report is an in-depth analysis detailing your home's value as well as a comparison with similar homes in the area
Home Values in the Area
Average Home Value in this Area
Purchase History
| Date | Buyer | Sale Price | Title Company |
|---|---|---|---|
| Nigro Antonio | $340,000 | Counsellors Title Agency Inc | |
| Nigro Antonio | $340,000 | Counsellors Title | |
| Sammarro Michael | $41,580 | -- |
Source: Public Records
Mortgage History
| Date | Status | Borrower | Loan Amount |
|---|---|---|---|
| Previous Owner | Nigro Antonio | $270,000 |
Source: Public Records
Tax History
| Year | Tax Paid | Tax Assessment Tax Assessment Total Assessment is a certain percentage of the fair market value that is determined by local assessors to be the total taxable value of land and additions on the property. | Land | Improvement |
|---|---|---|---|---|
| 2025 | $9,102 | $377,500 | $282,000 | $95,500 |
| 2024 | $8,758 | $377,500 | $282,000 | $95,500 |
| 2023 | $8,596 | $377,500 | $282,000 | $95,500 |
| 2022 | $8,596 | $377,500 | $282,000 | $95,500 |
| 2021 | $6,286 | $282,000 | $282,000 | $0 |
| 2020 | $7,512 | $337,000 | $282,000 | $55,000 |
| 2019 | $7,303 | $337,000 | $282,000 | $55,000 |
| 2018 | $7,279 | $337,000 | $282,000 | $55,000 |
| 2017 | $7,010 | $337,000 | $282,000 | $55,000 |
| 2016 | $6,973 | $337,000 | $282,000 | $55,000 |
| 2015 | $6,780 | $337,000 | $282,000 | $55,000 |
| 2014 | $6,588 | $337,000 | $282,000 | $55,000 |
Source: Public Records
Map
Nearby Homes
- 2200 S Ocean Ave Unit 304
- 19 9th Ln
- 45N Arlington Way Unit 112
- 45 Arlington Way
- 210 Midway Ave
- 809 S Ocean Ave
- 525 SW Central Ave
- 206 24th Ave
- 210 24th Ave
- 1409-1411 NW Central Ave
- 1409- 1411 NW Central Ave
- 58 I St
- 66 I St
- 12 I St
- 913 N Ocean Ave
- 1005 N Ocean Ave
- 111 K St Unit A2
- 225 K Ct
- 70 K St
- 121 L St