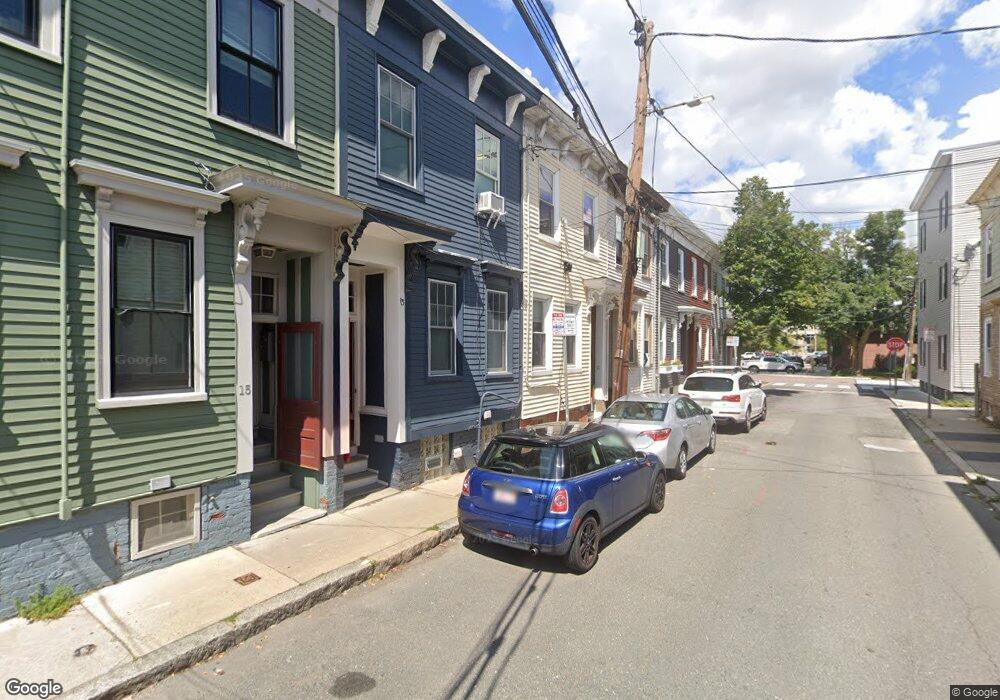
13 7th St Cambridge, MA 02141
East Cambridge NeighborhoodEstimated Value: $1,461,000 - $1,954,000
6
Beds
3
Baths
2,346
Sq Ft
$745/Sq Ft
Est. Value
About This Home
This home is located at 13 7th St, Cambridge, MA 02141 and is currently estimated at $1,747,524, approximately $744 per square foot. 13 7th St is a home located in Middlesex County with nearby schools including Prospect Hill Academy Charter School and Community Charter School of Cambridge.
Ownership History
Date
Name
Owned For
Owner Type
Purchase Details
Closed on
Oct 19, 2023
Sold by
Gaudette Caitlin and Gaudette Thomas
Bought by
Copilescu Anda and Akley Ryan W
Current Estimated Value
Home Financials for this Owner
Home Financials are based on the most recent Mortgage that was taken out on this home.
Original Mortgage
$1,360,000
Outstanding Balance
$1,333,257
Interest Rate
7.12%
Mortgage Type
Purchase Money Mortgage
Estimated Equity
$414,267
Purchase Details
Closed on
Sep 20, 2016
Sold by
Camelio Susan and Camelio Stephen
Bought by
Gaudette Caitlin and Gaudette Thomas
Create a Home Valuation Report for This Property
The Home Valuation Report is an in-depth analysis detailing your home's value as well as a comparison with similar homes in the area
Home Values in the Area
Average Home Value in this Area
Purchase History
| Date | Buyer | Sale Price | Title Company |
|---|---|---|---|
| Copilescu Anda | $1,700,000 | None Available | |
| Copilescu Anda | $1,700,000 | None Available | |
| Gaudette Caitlin | -- | -- | |
| Gaudette Caitlin | -- | -- |
Source: Public Records
Mortgage History
| Date | Status | Borrower | Loan Amount |
|---|---|---|---|
| Open | Copilescu Anda | $1,360,000 | |
| Closed | Copilescu Anda | $1,360,000 |
Source: Public Records
Tax History Compared to Growth
Tax History
| Year | Tax Paid | Tax Assessment Tax Assessment Total Assessment is a certain percentage of the fair market value that is determined by local assessors to be the total taxable value of land and additions on the property. | Land | Improvement |
|---|---|---|---|---|
| 2025 | $9,587 | $1,509,800 | $610,500 | $899,300 |
| 2024 | $8,482 | $1,432,700 | $660,000 | $772,700 |
| 2023 | $8,245 | $1,407,000 | $630,200 | $776,800 |
| 2022 | $5,588 | $980,800 | $632,800 | $348,000 |
| 2021 | $5,588 | $955,200 | $620,900 | $334,300 |
| 2020 | $5,557 | $966,500 | $626,700 | $339,800 |
| 2019 | $5,503 | $926,400 | $614,800 | $311,600 |
| 2018 | $4,961 | $788,700 | $509,800 | $278,900 |
| 2017 | $4,767 | $734,500 | $455,800 | $278,700 |
| 2016 | $4,305 | $615,900 | $356,900 | $259,000 |
| 2015 | $4,185 | $535,200 | $305,900 | $229,300 |
| 2014 | $3,701 | $441,600 | $236,900 | $204,700 |
Source: Public Records
Map
Nearby Homes
- 170 Gore St Unit 502
- 170 Gore St Unit 113
- 25 6th St
- 59 7th St Unit 2
- 59 7th St Unit 1
- 59 7th St Unit 3
- 9 Medford St Unit 3
- 1 Marion St Unit 1
- 1 Marion St Unit 6,7
- 1 Marion St Unit 4
- 1 Marion St Unit 6
- 1 Marion St Unit 7
- 747 Cambridge St Unit 2
- 71 Fulkerson St Unit 206
- 36 Sciarappa St
- 764 Cambridge St Unit 6
- 148 Berkshire St Unit 4
- 68 Gore St
- 1 Marney St
- 25 Marney St