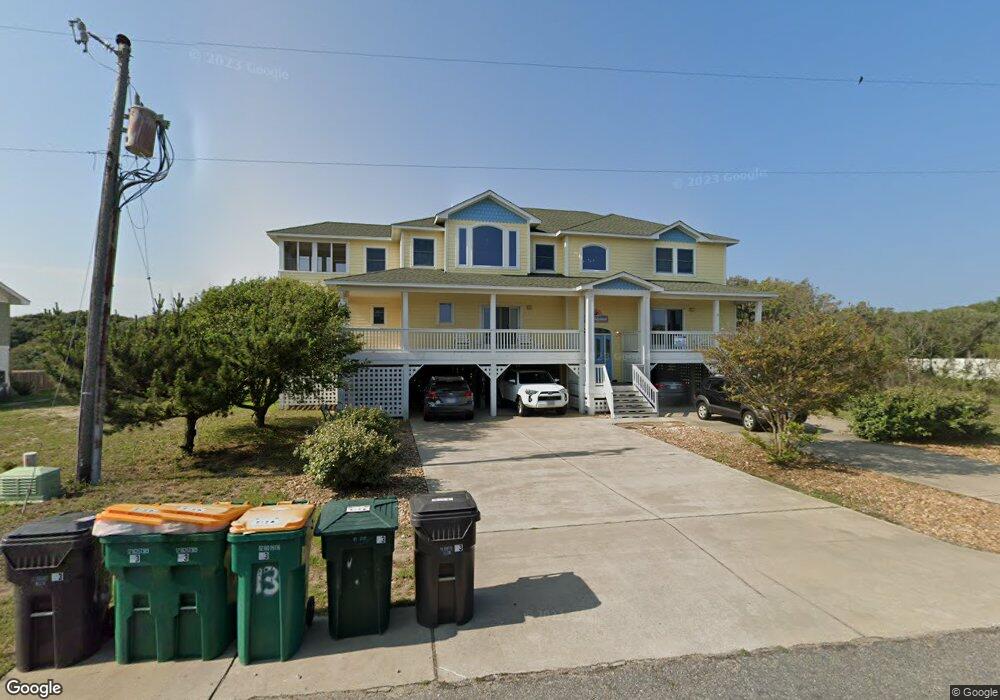
13 8th Ave Unit 9 Kitty Hawk, NC 27949
Estimated Value: $1,512,000 - $1,734,000
7
Beds
10
Baths
4,330
Sq Ft
$375/Sq Ft
Est. Value
About This Home
This home is located at 13 8th Ave Unit 9, Kitty Hawk, NC 27949 and is currently estimated at $1,623,602, approximately $374 per square foot. 13 8th Ave Unit 9 is a home located in Dare County with nearby schools including Kitty Hawk Elementary School, First Flight Middle School, and First Flight High School.
Ownership History
Date
Name
Owned For
Owner Type
Purchase Details
Closed on
Nov 17, 2021
Sold by
Jones Hugha and Santini Linda
Bought by
Auth Vincent G and Auth Doris A
Current Estimated Value
Home Financials for this Owner
Home Financials are based on the most recent Mortgage that was taken out on this home.
Original Mortgage
$558,390
Outstanding Balance
$511,668
Interest Rate
2.99%
Mortgage Type
New Conventional
Estimated Equity
$1,111,934
Purchase Details
Closed on
Nov 7, 2020
Sold by
Kasprzak John F and Kasprzak Karen D
Bought by
Jones Hugh A
Purchase Details
Closed on
Aug 29, 2012
Sold by
Minton Rodney D and Minton Kimberly P
Bought by
Kasprzak John F and Kasprzak Karen D
Home Financials for this Owner
Home Financials are based on the most recent Mortgage that was taken out on this home.
Original Mortgage
$417,000
Interest Rate
3.58%
Mortgage Type
New Conventional
Purchase Details
Closed on
Mar 25, 2008
Sold by
Aberdaron Ventures Inc
Bought by
Minton Rodney D and Minton Kimberly P
Create a Home Valuation Report for This Property
The Home Valuation Report is an in-depth analysis detailing your home's value as well as a comparison with similar homes in the area
Home Values in the Area
Average Home Value in this Area
Purchase History
| Date | Buyer | Sale Price | Title Company |
|---|---|---|---|
| Auth Vincent G | $1,305,000 | None Available | |
| Jones Hugh A | $895,000 | None Available | |
| Kasprzak John F | $860,000 | None Available | |
| Minton Rodney D | -- | None Available |
Source: Public Records
Mortgage History
| Date | Status | Borrower | Loan Amount |
|---|---|---|---|
| Open | Auth Vincent G | $558,390 | |
| Previous Owner | Kasprzak John F | $417,000 |
Source: Public Records
Tax History
| Year | Tax Paid | Tax Assessment Tax Assessment Total Assessment is a certain percentage of the fair market value that is determined by local assessors to be the total taxable value of land and additions on the property. | Land | Improvement |
|---|---|---|---|---|
| 2025 | $7,296 | $1,512,200 | $440,400 | $1,071,800 |
| 2024 | $6,633 | $963,800 | $243,000 | $720,800 |
| 2023 | $6,614 | $992,632 | $243,000 | $749,632 |
| 2022 | $6,614 | $992,632 | $243,000 | $749,632 |
| 2021 | $6,614 | $992,632 | $243,000 | $749,632 |
| 2020 | $5,919 | $992,632 | $243,000 | $749,632 |
| 2019 | $5,788 | $810,900 | $251,900 | $559,000 |
| 2018 | $5,788 | $810,900 | $251,900 | $559,000 |
| 2017 | $5,788 | $810,900 | $251,900 | $559,000 |
| 2016 | $5,453 | $810,900 | $251,900 | $559,000 |
| 2014 | $5,453 | $810,900 | $251,900 | $559,000 |
Source: Public Records
Map
Nearby Homes
- 15 7th Ave Unit Lot 10
- 40 9th Ave W Unit Lot 45
- 290 Wax Myrtle Trail Unit Lot 29
- 313 Hillcrest Dr Unit Lot 1
- 30 11th Ave W Unit Lot 63
- 305 Hillcrest Dr Unit Lot 5
- 343 Sea Oats Trail Unit Lot 10
- 269 Hillcrest Dr Unit Lot 1 A
- 2 Hickory Trail
- 45 N Dune Loop Unit Lot 55
- 126 Jay Crest Rd Unit 3
- 232 Wax Myrtle Trail Unit Lot 35
- 131 Brandon Ct Unit Lot 35
- 125 Seabreeze Dr
- 125 Seabreeze Dr Unit Lot 10
- 120 Tuckahoe Dr W Unit 75
- 102 Sea Hawk Dr E Unit Lot 19
- 215 Duck Rd Unit Lot 20
- 123 Georgetown Rd Unit 19
- 123 Georgetown Sands Rd Unit 24
Your Personal Tour Guide
Ask me questions while you tour the home.