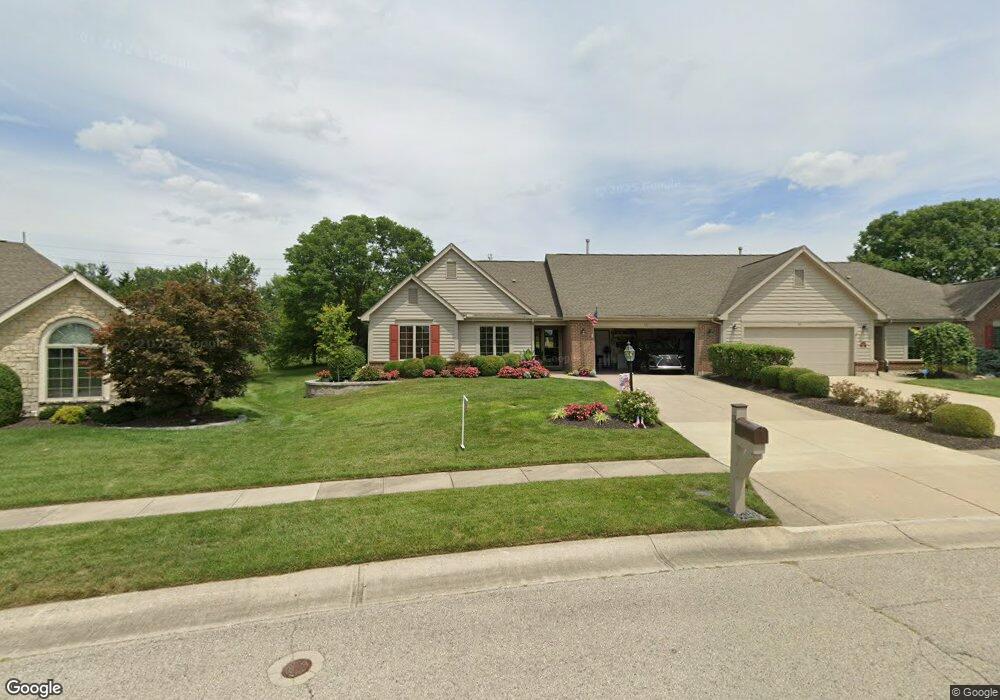
13 Aberfield Ln Miamisburg, OH 45342
Estimated Value: $337,570 - $368,000
2
Beds
2
Baths
1,968
Sq Ft
$180/Sq Ft
Est. Value
About This Home
This home is located at 13 Aberfield Ln, Miamisburg, OH 45342 and is currently estimated at $353,893, approximately $179 per square foot. 13 Aberfield Ln is a home located in Montgomery County with nearby schools including Miamisburg High School, Bishop Leibold School, and Dayton Christian School.
Ownership History
Date
Name
Owned For
Owner Type
Purchase Details
Closed on
Jul 30, 2019
Sold by
Mote Kimberly B and Mote Daniel E
Bought by
Kierstead Michael D and Kierstead Nancy C
Current Estimated Value
Home Financials for this Owner
Home Financials are based on the most recent Mortgage that was taken out on this home.
Original Mortgage
$172,500
Outstanding Balance
$151,078
Interest Rate
3.7%
Mortgage Type
New Conventional
Estimated Equity
$202,815
Purchase Details
Closed on
Oct 20, 2006
Sold by
Butts Barbara P and Butts Norman Earl
Bought by
Rolland Patricia B and Blevins Joseph D
Purchase Details
Closed on
Dec 4, 1998
Sold by
Vitolis Rastauskas and Vitolis Patricia J
Bought by
Negrelli Thomas J and Negrelli Audrey L
Purchase Details
Closed on
Sep 7, 1994
Sold by
Peth Nick A
Bought by
Nisbet Joe I and Blevins Barbara P
Create a Home Valuation Report for This Property
The Home Valuation Report is an in-depth analysis detailing your home's value as well as a comparison with similar homes in the area
Home Values in the Area
Average Home Value in this Area
Purchase History
| Date | Buyer | Sale Price | Title Company |
|---|---|---|---|
| Kierstead Michael D | $230,000 | Landmark Ttl Agcy South Inc | |
| Rolland Patricia B | -- | Attorney | |
| Negrelli Thomas J | $155,000 | -- | |
| Nisbet Joe I | -- | -- |
Source: Public Records
Mortgage History
| Date | Status | Borrower | Loan Amount |
|---|---|---|---|
| Open | Kierstead Michael D | $172,500 |
Source: Public Records
Tax History Compared to Growth
Tax History
| Year | Tax Paid | Tax Assessment Tax Assessment Total Assessment is a certain percentage of the fair market value that is determined by local assessors to be the total taxable value of land and additions on the property. | Land | Improvement |
|---|---|---|---|---|
| 2024 | $5,150 | $81,180 | $15,680 | $65,500 |
| 2023 | $5,150 | $81,180 | $15,680 | $65,500 |
| 2022 | $5,454 | $72,490 | $14,000 | $58,490 |
| 2021 | $4,823 | $72,490 | $14,000 | $58,490 |
| 2020 | $4,811 | $72,490 | $14,000 | $58,490 |
| 2019 | $4,640 | $64,130 | $14,000 | $50,130 |
| 2018 | $4,655 | $64,130 | $14,000 | $50,130 |
| 2017 | $4,623 | $64,130 | $14,000 | $50,130 |
| 2016 | $4,171 | $55,740 | $14,000 | $41,740 |
| 2015 | $4,089 | $55,740 | $14,000 | $41,740 |
| 2014 | $4,089 | $55,740 | $14,000 | $41,740 |
| 2012 | -- | $61,510 | $14,000 | $47,510 |
Source: Public Records
Map
Nearby Homes
- 1 Pendle Point
- 3902 Augusta Rd
- 9228 Sawgrass Dr
- 9220 Sawgrass Dr
- 1157 Bonniebrook Dr
- 2279 Rosina Dr
- 2127 Carrington Ln
- 2141 Rosina Dr
- 1834 Mellow Dr
- 2475 Byers Ridge Dr
- 9539 Byers Rd
- 2054 Prestwick Bend
- 736 Decker Dr
- 2434 Whisper Dr
- 712 Decker Dr
- 1984 Cruden Bay Way
- 628 Jamestown Dr
- 1350 Vista Ridge Dr
- 00 Benner Rd
- 1131 Castleton Ct
- 11 Aberfield Ln
- 15 Aberfield Ln
- 17 Aberfield Ln
- 17 Aberfield Ln
- 9 Aberfield Ln
- 16 Aberfield Ln
- 19 Aberfield Ln
- 7 Aberfield Ln
- 2 Stinton Ln
- 21 Aberfield Ln
- 18 Aberfield Ln
- 5 Aberfield Ln
- 4 Stinton Ln
- 23 Aberfield Ln
- 3 Aberfield Ln
- 20 Aberfield Ln
- 6 Stinton Ln
- 8 Aberfield Ln
- 1 Aberfield Ln
- 25 Aberfield Ln