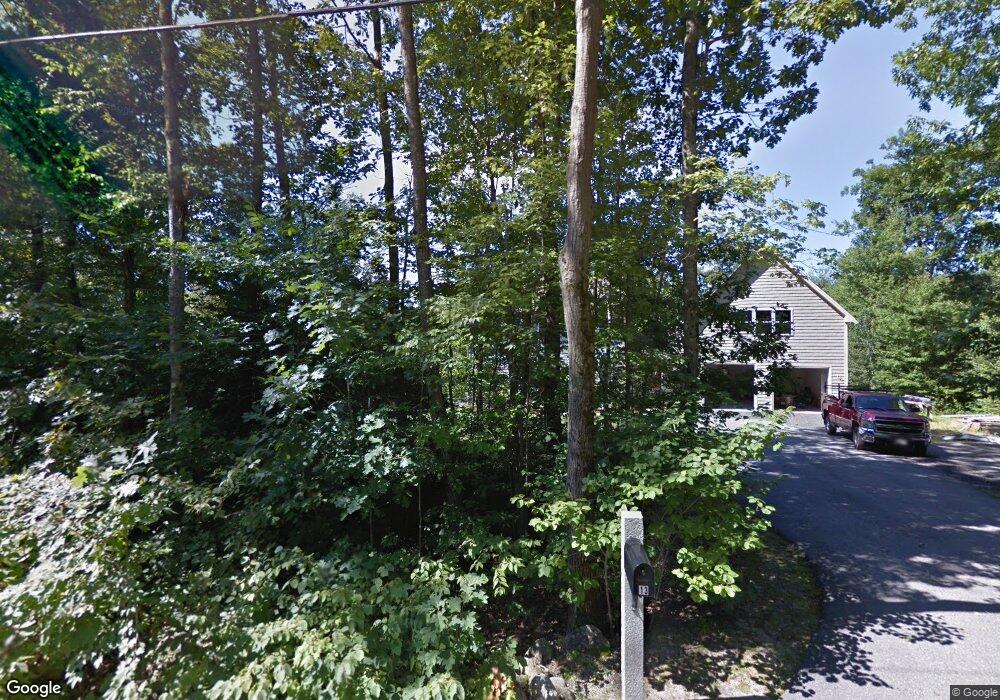
13 Adams Rd Hubbardston, MA 01452
Estimated Value: $468,000 - $531,000
3
Beds
2
Baths
1,536
Sq Ft
$321/Sq Ft
Est. Value
About This Home
This home is located at 13 Adams Rd, Hubbardston, MA 01452 and is currently estimated at $493,739, approximately $321 per square foot. 13 Adams Rd is a home located in Worcester County with nearby schools including Quabbin Regional Middle School and Quabbin Regional High School.
Ownership History
Date
Name
Owned For
Owner Type
Purchase Details
Closed on
Apr 28, 2000
Sold by
Olson Nathan J
Bought by
Thrasher Robert A and Thrasher Sherry L
Current Estimated Value
Purchase Details
Closed on
Nov 19, 1999
Sold by
Mason Richard J and Mason Rose M
Bought by
Olson Nathan J
Create a Home Valuation Report for This Property
The Home Valuation Report is an in-depth analysis detailing your home's value as well as a comparison with similar homes in the area
Home Values in the Area
Average Home Value in this Area
Purchase History
We collect this data history from publicly available records. To have your information removed, we recommend requesting removal directly through your county’s website.
| Date | Buyer | Sale Price | Title Company |
|---|---|---|---|
| Thrasher Robert A | $160,000 | -- | |
| Olson Nathan J | $200,000 | -- |
Source: Public Records
Mortgage History
We collect this data history from publicly available records. To have your information removed, we recommend requesting removal directly through your county’s website.
| Date | Status | Borrower | Loan Amount |
|---|---|---|---|
| Open | Olson Nathan J | $182,000 | |
| Closed | Olson Nathan J | $10,000 | |
| Closed | Olson Nathan J | $190,000 |
Source: Public Records
Tax History
| Year | Tax Paid | Tax Assessment Tax Assessment Total Assessment is a certain percentage of the fair market value that is determined by local assessors to be the total taxable value of land and additions on the property. | Land | Improvement |
|---|---|---|---|---|
| 2025 | $5,295 | $453,300 | $57,200 | $396,100 |
| 2024 | $5,150 | $436,800 | $51,300 | $385,500 |
| 2023 | $4,316 | $331,200 | $45,700 | $285,500 |
| 2022 | $4,637 | $331,200 | $45,700 | $285,500 |
| 2021 | $4,646 | $313,700 | $45,700 | $268,000 |
| 2020 | $4,572 | $308,500 | $45,700 | $262,800 |
| 2019 | $4,463 | $293,200 | $60,100 | $233,100 |
| 2018 | $2,633 | $284,100 | $60,100 | $224,000 |
| 2017 | $2,582 | $284,100 | $60,100 | $224,000 |
| 2016 | $3,717 | $233,800 | $60,100 | $173,700 |
| 2015 | $3,694 | $247,600 | $60,100 | $187,500 |
| 2014 | $3,595 | $247,600 | $60,100 | $187,500 |
Source: Public Records
Map
Nearby Homes
Your Personal Tour Guide
Ask me questions while you tour the home.