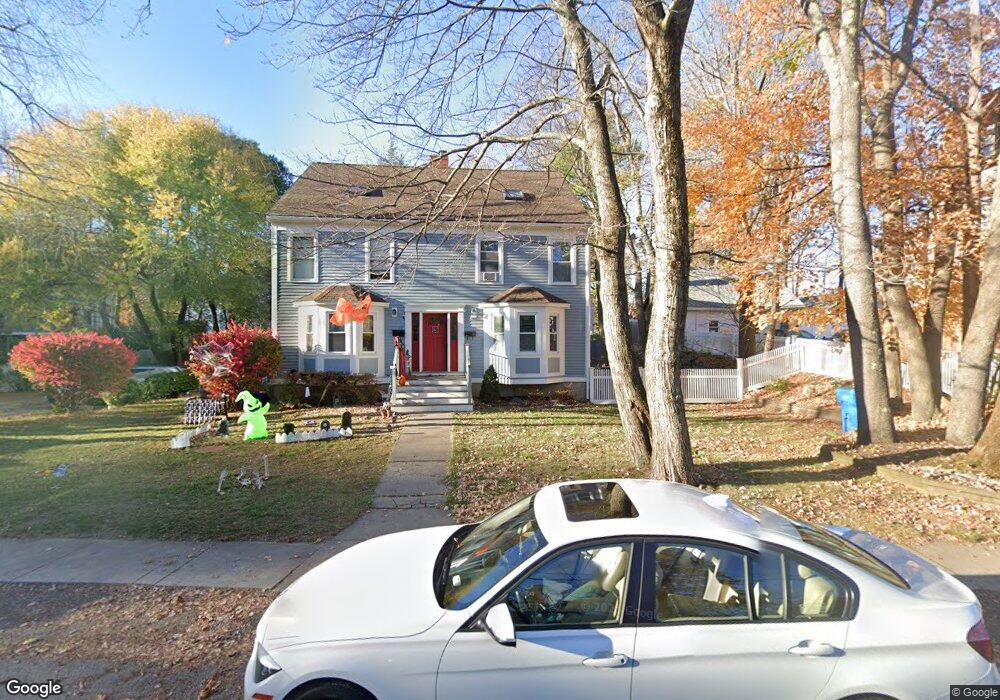
13 Adams St Unit 1 Merrimac, MA 01860
Estimated Value: $413,000 - $490,000
2
Beds
2
Baths
1,309
Sq Ft
$345/Sq Ft
Est. Value
About This Home
This home is located at 13 Adams St Unit 1, Merrimac, MA 01860 and is currently estimated at $451,079, approximately $344 per square foot. 13 Adams St Unit 1 is a home located in Essex County with nearby schools including Pentucket Regional High School.
Ownership History
Date
Name
Owned For
Owner Type
Purchase Details
Closed on
Jun 11, 2024
Sold by
Wayne D & Debra Jones Ret and Jones
Bought by
Wayne D & Debra Jones Ret and Jones
Current Estimated Value
Purchase Details
Closed on
Jun 12, 2000
Sold by
Jones Myrna R
Bought by
Jones Wayne D and Jones Debra
Home Financials for this Owner
Home Financials are based on the most recent Mortgage that was taken out on this home.
Original Mortgage
$73,000
Interest Rate
8.12%
Mortgage Type
Purchase Money Mortgage
Purchase Details
Closed on
Oct 28, 1993
Sold by
Family Mutual S B
Bought by
Jones Earle T and Jones Myrna R
Home Financials for this Owner
Home Financials are based on the most recent Mortgage that was taken out on this home.
Original Mortgage
$76,000
Interest Rate
6.86%
Mortgage Type
Purchase Money Mortgage
Purchase Details
Closed on
Nov 19, 1992
Sold by
Yuhasz Wayne D
Bought by
Essex Holdings Inc
Purchase Details
Closed on
May 27, 1988
Sold by
Clear Valley Rt
Bought by
Valli Mark A
Create a Home Valuation Report for This Property
The Home Valuation Report is an in-depth analysis detailing your home's value as well as a comparison with similar homes in the area
Home Values in the Area
Average Home Value in this Area
Purchase History
| Date | Buyer | Sale Price | Title Company |
|---|---|---|---|
| Wayne D & Debra Jones Ret | -- | None Available | |
| Wayne D & Debra Jones Ret | -- | None Available | |
| Jones Wayne D | $71,000 | -- | |
| Jones Wayne D | $71,000 | -- | |
| Jones Earle T | $95,000 | -- | |
| Jones Earle T | $95,000 | -- | |
| Essex Holdings Inc | $92,000 | -- | |
| Essex Holdings Inc | $92,000 | -- | |
| Valli Mark A | $98,000 | -- |
Source: Public Records
Mortgage History
| Date | Status | Borrower | Loan Amount |
|---|---|---|---|
| Previous Owner | Valli Mark A | $73,000 | |
| Previous Owner | Valli Mark A | $76,000 |
Source: Public Records
Tax History Compared to Growth
Tax History
| Year | Tax Paid | Tax Assessment Tax Assessment Total Assessment is a certain percentage of the fair market value that is determined by local assessors to be the total taxable value of land and additions on the property. | Land | Improvement |
|---|---|---|---|---|
| 2025 | $4,661 | $351,800 | $0 | $351,800 |
| 2024 | $4,655 | $344,800 | $0 | $344,800 |
| 2023 | $4,812 | $325,800 | $0 | $325,800 |
| 2022 | $4,856 | $297,200 | $0 | $297,200 |
| 2021 | $4,535 | $278,200 | $0 | $278,200 |
| 2020 | $3,857 | $259,200 | $0 | $259,200 |
| 2019 | $3,760 | $237,800 | $0 | $237,800 |
| 2018 | $3,689 | $234,100 | $0 | $234,100 |
| 2017 | $3,523 | $215,600 | $0 | $215,600 |
| 2016 | $3,365 | $208,200 | $0 | $208,200 |
| 2015 | $3,237 | $199,200 | $0 | $199,200 |
| 2014 | $3,165 | $199,200 | $0 | $199,200 |
Source: Public Records
Map
Nearby Homes