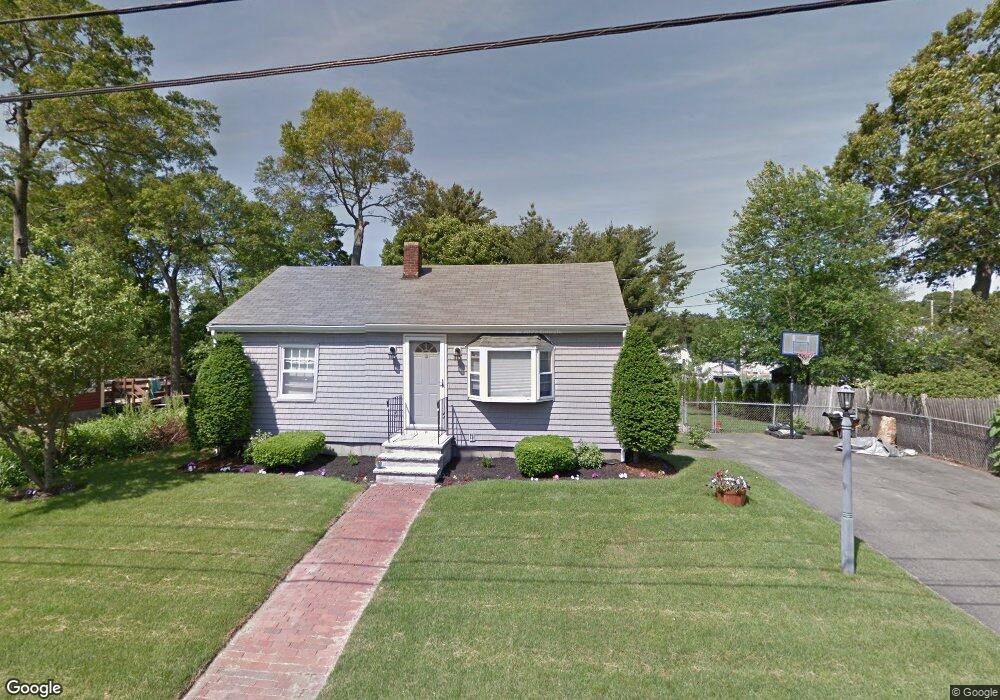
13 Allen St Abington, MA 02351
Estimated Value: $402,000 - $460,000
2
Beds
1
Bath
820
Sq Ft
$530/Sq Ft
Est. Value
About This Home
This home is located at 13 Allen St, Abington, MA 02351 and is currently estimated at $434,693, approximately $530 per square foot. 13 Allen St is a home located in Plymouth County with nearby schools including Beaver Brook Elementary School, Abington Middle School, and Woodsdale School.
Ownership History
Date
Name
Owned For
Owner Type
Purchase Details
Closed on
Aug 25, 2000
Sold by
Vaughan William R and Vaughan Lynn M
Bought by
Sutter Susan C
Current Estimated Value
Home Financials for this Owner
Home Financials are based on the most recent Mortgage that was taken out on this home.
Original Mortgage
$158,589
Interest Rate
8.06%
Mortgage Type
Purchase Money Mortgage
Purchase Details
Closed on
Jun 11, 1991
Sold by
Urban Cheryl A and Hoyte Diane J
Bought by
Vaughan Wm R and Chamberlain Lynn
Home Financials for this Owner
Home Financials are based on the most recent Mortgage that was taken out on this home.
Original Mortgage
$120,667
Interest Rate
9.42%
Mortgage Type
Purchase Money Mortgage
Create a Home Valuation Report for This Property
The Home Valuation Report is an in-depth analysis detailing your home's value as well as a comparison with similar homes in the area
Home Values in the Area
Average Home Value in this Area
Purchase History
| Date | Buyer | Sale Price | Title Company |
|---|---|---|---|
| Sutter Susan C | $160,000 | -- | |
| Vaughan Wm R | $122,000 | -- |
Source: Public Records
Mortgage History
| Date | Status | Borrower | Loan Amount |
|---|---|---|---|
| Open | Vaughan Wm R | $156,969 | |
| Closed | Vaughan Wm R | $158,589 | |
| Previous Owner | Vaughan Wm R | $23,000 | |
| Previous Owner | Vaughan Wm R | $120,667 |
Source: Public Records
Tax History Compared to Growth
Tax History
| Year | Tax Paid | Tax Assessment Tax Assessment Total Assessment is a certain percentage of the fair market value that is determined by local assessors to be the total taxable value of land and additions on the property. | Land | Improvement |
|---|---|---|---|---|
| 2025 | $5,382 | $412,100 | $237,000 | $175,100 |
| 2024 | $5,063 | $378,400 | $215,500 | $162,900 |
| 2023 | $5,091 | $358,300 | $187,300 | $171,000 |
| 2022 | $4,943 | $324,800 | $163,900 | $160,900 |
| 2021 | $4,633 | $281,100 | $148,700 | $132,400 |
| 2020 | $4,786 | $281,500 | $145,000 | $136,500 |
| 2019 | $4,290 | $246,700 | $138,100 | $108,600 |
| 2018 | $4,341 | $243,600 | $138,100 | $105,500 |
| 2017 | $4,048 | $220,600 | $138,100 | $82,500 |
| 2016 | $3,720 | $207,500 | $131,500 | $76,000 |
| 2015 | $3,347 | $196,900 | $131,500 | $65,400 |
Source: Public Records
Map
Nearby Homes