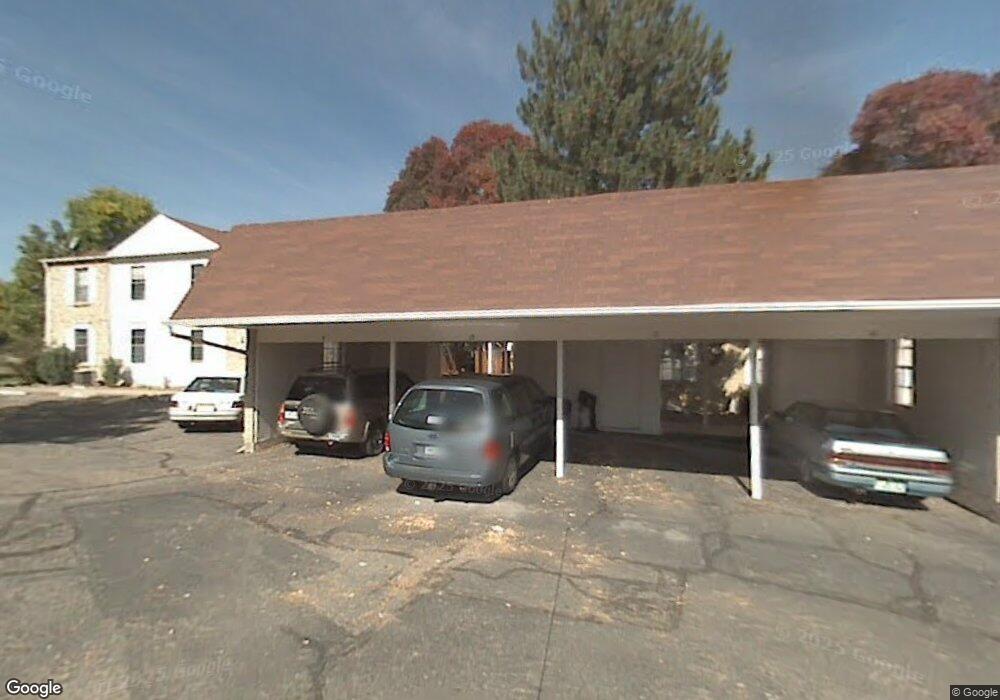
13 Amesbury St Unit 235 Broomfield, CO 80020
Northmoor Estates NeighborhoodEstimated Value: $350,000 - $408,000
3
Beds
2
Baths
1,448
Sq Ft
$262/Sq Ft
Est. Value
About This Home
This home is located at 13 Amesbury St Unit 235, Broomfield, CO 80020 and is currently estimated at $378,657, approximately $261 per square foot. 13 Amesbury St Unit 235 is a home located in Broomfield County with nearby schools including Birch Elementary School, Aspen Creek K-8 School, and Broomfield High School.
Ownership History
Date
Name
Owned For
Owner Type
Purchase Details
Closed on
Mar 2, 2022
Sold by
Accept Holdings And Relocation Llc
Bought by
Henry Noeile and Henry Ethan
Current Estimated Value
Home Financials for this Owner
Home Financials are based on the most recent Mortgage that was taken out on this home.
Original Mortgage
$368,450
Outstanding Balance
$343,347
Interest Rate
3.69%
Mortgage Type
New Conventional
Estimated Equity
$35,310
Purchase Details
Closed on
Feb 24, 2022
Sold by
Opendoor Property Trust
Bought by
Accept Holdings And Relocation Llc
Home Financials for this Owner
Home Financials are based on the most recent Mortgage that was taken out on this home.
Original Mortgage
$368,450
Outstanding Balance
$343,347
Interest Rate
3.69%
Mortgage Type
New Conventional
Estimated Equity
$35,310
Purchase Details
Closed on
Nov 2, 2021
Sold by
Tinaglia Connor and Mayo Teresa
Bought by
Opendoor Property Trus Ti
Purchase Details
Closed on
May 6, 2020
Sold by
Olen Robert and Lund Linda Michelle
Bought by
Tinaglia Connor and Mayo Theresa
Home Financials for this Owner
Home Financials are based on the most recent Mortgage that was taken out on this home.
Original Mortgage
$11,017
Interest Rate
3.5%
Mortgage Type
FHA
Purchase Details
Closed on
Jun 30, 2017
Sold by
Anderson Joyce A
Bought by
Lund Linda Michelle and Lund Robert Olen
Home Financials for this Owner
Home Financials are based on the most recent Mortgage that was taken out on this home.
Original Mortgage
$21,600
Interest Rate
4.02%
Mortgage Type
New Conventional
Purchase Details
Closed on
Oct 30, 2012
Sold by
Wagner Marilyn Glass
Bought by
Anderson Joyce A
Home Financials for this Owner
Home Financials are based on the most recent Mortgage that was taken out on this home.
Original Mortgage
$86,688
Interest Rate
3.52%
Mortgage Type
New Conventional
Purchase Details
Closed on
Jan 26, 2005
Sold by
Gillespie Natalie M and Ness Donyce L Gillespie
Bought by
Wagner Marilyn Glass
Home Financials for this Owner
Home Financials are based on the most recent Mortgage that was taken out on this home.
Original Mortgage
$161,105
Interest Rate
5.71%
Mortgage Type
FHA
Purchase Details
Closed on
Apr 1, 2004
Sold by
Ness Glen A and Ness Glen Andrew
Bought by
Ness Donyce L Gillespie
Purchase Details
Closed on
May 1, 2001
Sold by
Ness Glen A
Bought by
Gillespie Natalie M
Purchase Details
Closed on
Nov 21, 1996
Purchase Details
Closed on
May 23, 1989
Create a Home Valuation Report for This Property
The Home Valuation Report is an in-depth analysis detailing your home's value as well as a comparison with similar homes in the area
Home Values in the Area
Average Home Value in this Area
Purchase History
| Date | Buyer | Sale Price | Title Company |
|---|---|---|---|
| Henry Noeile | $385,000 | None Listed On Document | |
| Accept Holdings And Relocation Llc | $400,000 | Os National Llc | |
| Opendoor Property Trus Ti | $342,300 | Os National Llc | |
| Tinaglia Connor | $280,500 | Land Title Guarantee | |
| Lund Linda Michelle | $250,000 | Land Title Guarantee Co | |
| Anderson Joyce A | $108,360 | Land Title Guarantee Company | |
| Wagner Marilyn Glass | $163,500 | Land Title | |
| Ness Donyce L Gillespie | -- | -- | |
| Gillespie Natalie M | $43,000 | -- | |
| -- | $69,500 | -- | |
| -- | $41,500 | -- |
Source: Public Records
Mortgage History
| Date | Status | Borrower | Loan Amount |
|---|---|---|---|
| Open | Henry Noeile | $368,450 | |
| Previous Owner | Tinaglia Connor | $11,017 | |
| Previous Owner | Lund Linda Michelle | $21,600 | |
| Previous Owner | Anderson Joyce A | $86,688 | |
| Previous Owner | Wagner Marilyn Glass | $161,105 |
Source: Public Records
Tax History Compared to Growth
Tax History
| Year | Tax Paid | Tax Assessment Tax Assessment Total Assessment is a certain percentage of the fair market value that is determined by local assessors to be the total taxable value of land and additions on the property. | Land | Improvement |
|---|---|---|---|---|
| 2025 | $2,229 | $23,870 | $5,030 | $18,840 |
| 2024 | $2,229 | $23,790 | $4,350 | $19,440 |
| 2023 | $2,225 | $28,500 | $5,210 | $23,290 |
| 2022 | $1,876 | $19,400 | $3,820 | $15,580 |
| 2021 | $1,865 | $19,950 | $3,930 | $16,020 |
| 2020 | $1,785 | $18,970 | $3,580 | $15,390 |
| 2019 | $1,781 | $19,090 | $3,600 | $15,490 |
| 2018 | $1,365 | $14,460 | $2,230 | $12,230 |
| 2017 | $1,344 | $15,990 | $2,470 | $13,520 |
| 2016 | $1,149 | $12,180 | $3,740 | $8,440 |
| 2015 | $1,109 | $9,470 | $3,740 | $5,730 |
| 2014 | $881 | $9,470 | $3,740 | $5,730 |
Source: Public Records
Map
Nearby Homes
- 1273 Cottonwood St
- 1346 Dexter St
- 1181 Cottonwood St
- 1705 Dover St
- 1723 Elmwood St
- 4614 Red Deer Trail
- 951 E 10th Ave
- 763 Dexter Dr
- 1118 Oakhurst Dr
- 1732 Peregrine Ln
- 12565 Sheridan Blvd Unit 115
- 583 Redstone Dr
- 114 E 14th Ct
- 37 E 14th Place
- 12695 Wolff St
- 13848 Teal Creek Dr
- 12647 Davis St
- 13 Curtis Ct
- 13961 Brookside Ct
- 3981 W 127th Ave