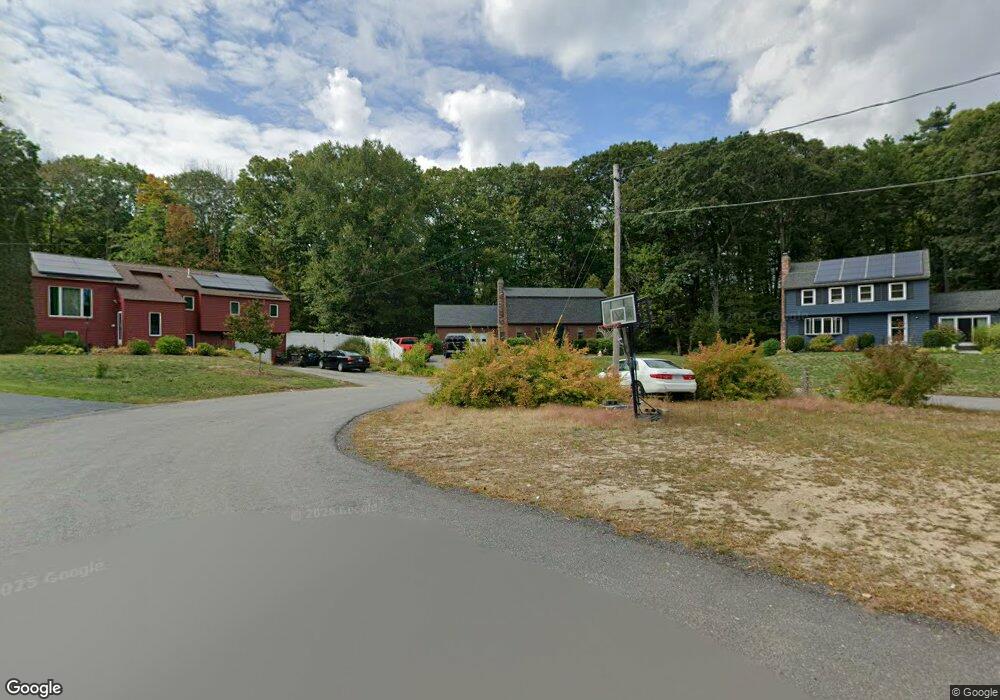
13 Aquarius Ln Unit 1 Townsend, MA 01469
Estimated Value: $510,000 - $554,000
3
Beds
3
Baths
1,686
Sq Ft
$314/Sq Ft
Est. Value
About This Home
This home is located at 13 Aquarius Ln Unit 1, Townsend, MA 01469 and is currently estimated at $528,642, approximately $313 per square foot. 13 Aquarius Ln Unit 1 is a home located in Middlesex County with nearby schools including North Middlesex Regional High School.
Ownership History
Date
Name
Owned For
Owner Type
Purchase Details
Closed on
Jun 30, 2016
Sold by
Abernathy Laura
Bought by
Piper Jennifer
Current Estimated Value
Home Financials for this Owner
Home Financials are based on the most recent Mortgage that was taken out on this home.
Original Mortgage
$260,300
Outstanding Balance
$207,798
Interest Rate
3.58%
Mortgage Type
New Conventional
Estimated Equity
$320,844
Purchase Details
Closed on
Aug 24, 2005
Sold by
Novello James W
Bought by
Halligan Laura
Home Financials for this Owner
Home Financials are based on the most recent Mortgage that was taken out on this home.
Original Mortgage
$25,000
Interest Rate
5.68%
Mortgage Type
Purchase Money Mortgage
Purchase Details
Closed on
Dec 31, 2002
Sold by
Mcbreen Frederick E and Mcbreen Diane B
Bought by
Novello James W
Home Financials for this Owner
Home Financials are based on the most recent Mortgage that was taken out on this home.
Original Mortgage
$216,000
Interest Rate
6.02%
Mortgage Type
Purchase Money Mortgage
Create a Home Valuation Report for This Property
The Home Valuation Report is an in-depth analysis detailing your home's value as well as a comparison with similar homes in the area
Home Values in the Area
Average Home Value in this Area
Purchase History
| Date | Buyer | Sale Price | Title Company |
|---|---|---|---|
| Piper Jennifer | $274,000 | -- | |
| Halligan Laura | $312,500 | -- | |
| Novello James W | $270,000 | -- |
Source: Public Records
Mortgage History
| Date | Status | Borrower | Loan Amount |
|---|---|---|---|
| Open | Piper Jennifer | $260,300 | |
| Previous Owner | Halligan Laura | $25,000 | |
| Previous Owner | Novello James W | $216,000 |
Source: Public Records
Tax History Compared to Growth
Tax History
| Year | Tax Paid | Tax Assessment Tax Assessment Total Assessment is a certain percentage of the fair market value that is determined by local assessors to be the total taxable value of land and additions on the property. | Land | Improvement |
|---|---|---|---|---|
| 2025 | $6,207 | $427,500 | $91,000 | $336,500 |
| 2024 | $6,045 | $419,500 | $91,000 | $328,500 |
| 2023 | $5,996 | $392,900 | $78,600 | $314,300 |
| 2022 | $5,991 | $340,200 | $72,000 | $268,200 |
| 2021 | $5,818 | $317,400 | $71,100 | $246,300 |
| 2020 | $5,659 | $289,900 | $64,500 | $225,400 |
| 2019 | $5,414 | $280,100 | $64,500 | $215,600 |
| 2018 | $5,014 | $247,500 | $57,900 | $189,600 |
| 2017 | $4,636 | $235,700 | $60,800 | $174,900 |
| 2016 | $4,467 | $225,600 | $60,800 | $164,800 |
| 2015 | $4,328 | $226,500 | $67,400 | $159,100 |
| 2014 | $4,135 | $211,300 | $63,300 | $148,000 |
Source: Public Records
Map
Nearby Homes
- 64 Maplewood Dr
- 5 Chestnut Dr
- Lot 10 Christian Cir
- 55 Beachview Rd
- 28 Beech St
- 18 Beech St
- 167 S Row Rd
- 31 South St
- 00 Tyler Rd
- 2 Tamarack Ln
- 91 Valley Rd
- 18 Crosswinds Dr
- 144 Main St
- 7 Hickory Ln
- 1790 Massachusetts Ave Unit 25
- 1790 Mass Ave Unit 3
- 1790 Massachusetts Ave Unit 22
- 111 Squannacook Rd
- 7a Lilac Cir Unit B
- 49 Magnolia Ln Unit 49