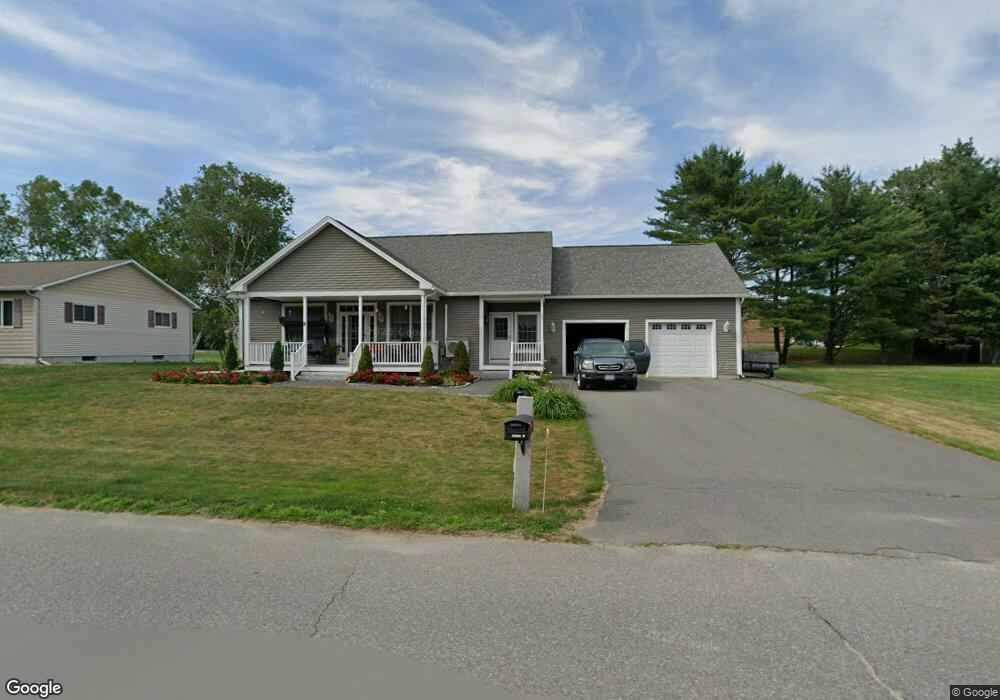
13 Barnet Ave Waterville, ME 04901
Estimated Value: $358,000 - $388,000
2
Beds
2
Baths
1,880
Sq Ft
$198/Sq Ft
Est. Value
About This Home
This home is located at 13 Barnet Ave, Waterville, ME 04901 and is currently estimated at $372,429, approximately $198 per square foot. 13 Barnet Ave is a home with nearby schools including George J. Mitchell School, Albert S. Hall School, and Waterville Junior High School.
Ownership History
Date
Name
Owned For
Owner Type
Purchase Details
Closed on
Jul 1, 2009
Sold by
Rancourt Richard
Bought by
Poulin Aline and Poulin Peter
Current Estimated Value
Purchase Details
Closed on
May 18, 2007
Sold by
Jolovitz Lester T
Bought by
Rancourt Richard
Create a Home Valuation Report for This Property
The Home Valuation Report is an in-depth analysis detailing your home's value as well as a comparison with similar homes in the area
Home Values in the Area
Average Home Value in this Area
Purchase History
| Date | Buyer | Sale Price | Title Company |
|---|---|---|---|
| Poulin Aline | -- | -- | |
| Rancourt Richard | $18,500 | -- |
Source: Public Records
Tax History Compared to Growth
Tax History
| Year | Tax Paid | Tax Assessment Tax Assessment Total Assessment is a certain percentage of the fair market value that is determined by local assessors to be the total taxable value of land and additions on the property. | Land | Improvement |
|---|---|---|---|---|
| 2025 | $7,004 | $412,000 | $30,300 | $381,700 |
| 2024 | $6,680 | $334,000 | $23,300 | $310,700 |
| 2023 | $6,647 | $334,000 | $23,300 | $310,700 |
| 2022 | $5,643 | $218,300 | $17,500 | $200,800 |
| 2021 | $5,567 | $218,300 | $17,500 | $200,800 |
| 2020 | $5,623 | $218,300 | $17,500 | $200,800 |
| 2019 | $5,623 | $218,300 | $17,500 | $200,800 |
| 2018 | $5,516 | $218,300 | $17,500 | $200,800 |
| 2017 | $5,093 | $218,300 | $17,500 | $200,800 |
| 2016 | $4,977 | $218,300 | $17,500 | $200,800 |
| 2015 | $4,278 | $153,900 | $19,200 | $134,700 |
| 2014 | $4,217 | $153,900 | $19,200 | $134,700 |
| 2013 | $4,217 | $153,900 | $19,200 | $134,700 |
Source: Public Records
Map
Nearby Homes