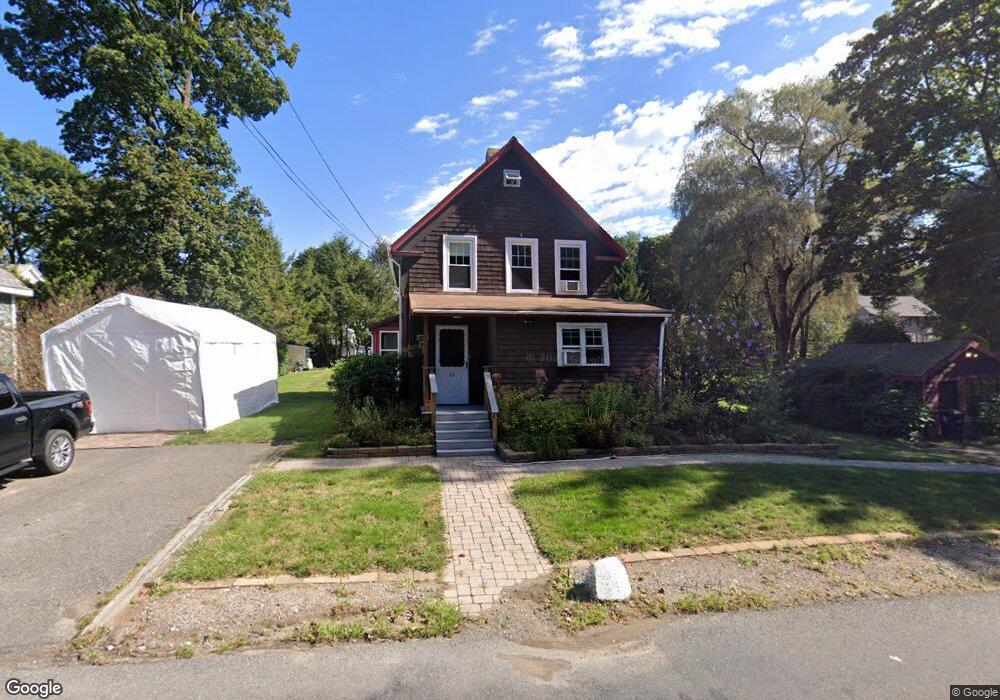
13 Beach St Wrentham, MA 02093
Estimated Value: $469,000 - $538,000
3
Beds
1
Bath
1,028
Sq Ft
$485/Sq Ft
Est. Value
About This Home
This home is located at 13 Beach St, Wrentham, MA 02093 and is currently estimated at $498,576, approximately $484 per square foot. 13 Beach St is a home located in Norfolk County with nearby schools including Delaney Elementary School and Charles E Roderick.
Ownership History
Date
Name
Owned For
Owner Type
Purchase Details
Closed on
Oct 22, 2010
Sold by
Seymour Erik J and Seymour Carilynore D
Bought by
Seymour Ft
Current Estimated Value
Purchase Details
Closed on
Jul 29, 1999
Sold by
Condon Redmond R and Condon Charlotte L
Bought by
Seymour Erik and Seymour Carilynore
Home Financials for this Owner
Home Financials are based on the most recent Mortgage that was taken out on this home.
Original Mortgage
$163,900
Interest Rate
7.61%
Mortgage Type
Purchase Money Mortgage
Create a Home Valuation Report for This Property
The Home Valuation Report is an in-depth analysis detailing your home's value as well as a comparison with similar homes in the area
Home Values in the Area
Average Home Value in this Area
Purchase History
| Date | Buyer | Sale Price | Title Company |
|---|---|---|---|
| Seymour Ft | -- | -- | |
| Seymour Erik | $169,000 | -- |
Source: Public Records
Mortgage History
| Date | Status | Borrower | Loan Amount |
|---|---|---|---|
| Previous Owner | Seymour Erik | $161,500 | |
| Previous Owner | Seymour Erik | $163,900 | |
| Previous Owner | Seymour Erik | $58,500 |
Source: Public Records
Tax History Compared to Growth
Tax History
| Year | Tax Paid | Tax Assessment Tax Assessment Total Assessment is a certain percentage of the fair market value that is determined by local assessors to be the total taxable value of land and additions on the property. | Land | Improvement |
|---|---|---|---|---|
| 2025 | $4,865 | $419,800 | $237,200 | $182,600 |
| 2024 | $4,627 | $385,600 | $237,200 | $148,400 |
| 2023 | $4,435 | $351,400 | $215,700 | $135,700 |
| 2022 | $4,388 | $321,000 | $209,800 | $111,200 |
| 2021 | $4,298 | $305,500 | $196,000 | $109,500 |
| 2020 | $3,773 | $264,800 | $149,600 | $115,200 |
| 2019 | $3,899 | $276,100 | $164,600 | $111,500 |
| 2018 | $3,768 | $264,600 | $164,700 | $99,900 |
| 2017 | $3,578 | $251,100 | $161,500 | $89,600 |
| 2016 | $3,456 | $242,000 | $156,900 | $85,100 |
| 2015 | $3,379 | $225,600 | $150,800 | $74,800 |
| 2014 | $3,316 | $216,600 | $145,000 | $71,600 |
Source: Public Records
Map
Nearby Homes
- Lot 1 - Blueberry 2 Car Plan at King Philip Estates
- Lot 8 - Blueberry 2 Car Plan at King Philip Estates
- Lot 5 - Hughes 2 car Plan at King Philip Estates
- Lot 6 - Blueberry 3 Car Plan at King Philip Estates
- Lot 2 - Camden 2 Car Plan at King Philip Estates
- Lot 7 - Cedar Plan at King Philip Estates
- Lot 4 - Hemingway 2 Car Plan at King Philip Estates
- Lot 3 - Blueberry 2 Car Plan at King Philip Estates
- Lot 3 - 14 Earle Stewart Ln
- 11 Earle Stewart Ln
- 791 South St Unit 5
- 131 Creek St Unit 7
- 319 Taunton St
- 10 Nature View Dr
- 15 Nature View Dr
- 570 Franklin St
- 155 Clark Rd Unit 155
- 1204 South St
- 1222 South St
- 362 East St
- 499 South St
- 491 South St
- 485 South St
- 513 South St
- 513 South St Unit 201
- 513 South St Unit 202
- 513 South St Unit 205
- 513 South St Unit 203
- 513 South St Unit 204
- 483 South St
- 490 South St Unit 2
- 490 South St
- 490 South St Unit 1
- 490 South St Unit 3
- 1 Gibbons Ln
- 479 South St
- 37 Beach St
- 25 Beach St
- LOT 2 Gibbons Ln
- 2 Gibbons Ln