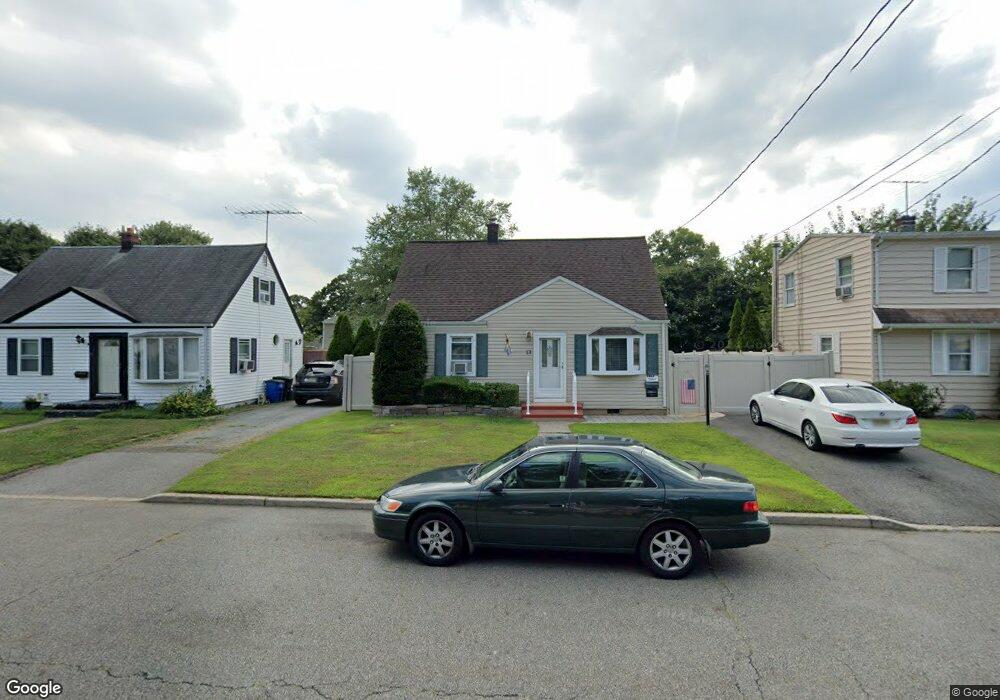
13 Bergen Ave Haskell, NJ 07420
Estimated Value: $398,126 - $488,000
Studio
--
Bath
1,056
Sq Ft
$411/Sq Ft
Est. Value
About This Home
This home is located at 13 Bergen Ave, Haskell, NJ 07420 and is currently estimated at $433,532, approximately $410 per square foot. 13 Bergen Ave is a home located in Passaic County with nearby schools including Lakeland Reg High School and St Marys School.
Ownership History
Date
Name
Owned For
Owner Type
Purchase Details
Closed on
Nov 30, 2006
Sold by
Mangerpan Michael
Bought by
Diaz Angel
Current Estimated Value
Home Financials for this Owner
Home Financials are based on the most recent Mortgage that was taken out on this home.
Original Mortgage
$295,365
Outstanding Balance
$176,397
Interest Rate
6.29%
Mortgage Type
FHA
Estimated Equity
$257,135
Purchase Details
Closed on
Jun 26, 2002
Sold by
Prussin Lucille
Bought by
Mangerpan Michael and Mangerpan Jennifer
Home Financials for this Owner
Home Financials are based on the most recent Mortgage that was taken out on this home.
Original Mortgage
$170,000
Interest Rate
6.79%
Purchase Details
Closed on
Jul 20, 1999
Sold by
Meyers Andrew and Meyers Teresa
Bought by
Prussin Lucille and Prussin Kimberly
Home Financials for this Owner
Home Financials are based on the most recent Mortgage that was taken out on this home.
Original Mortgage
$108,000
Interest Rate
7.61%
Mortgage Type
Stand Alone First
Create a Home Valuation Report for This Property
The Home Valuation Report is an in-depth analysis detailing your home's value as well as a comparison with similar homes in the area
Home Values in the Area
Average Home Value in this Area
Purchase History
| Date | Buyer | Sale Price | Title Company |
|---|---|---|---|
| Diaz Angel | $300,000 | -- | |
| Mangerpan Michael | $179,000 | -- | |
| Prussin Lucille | $135,000 | -- |
Source: Public Records
Mortgage History
| Date | Status | Borrower | Loan Amount |
|---|---|---|---|
| Open | Diaz Angel | $295,365 | |
| Previous Owner | Mangerpan Michael | $170,000 | |
| Previous Owner | Prussin Lucille | $108,000 |
Source: Public Records
Tax History
| Year | Tax Paid | Tax Assessment Tax Assessment Total Assessment is a certain percentage of the fair market value that is determined by local assessors to be the total taxable value of land and additions on the property. | Land | Improvement |
|---|---|---|---|---|
| 2025 | $7,492 | $173,700 | $99,600 | $74,100 |
| 2024 | $7,342 | $173,700 | $99,600 | $74,100 |
| 2022 | $7,188 | $173,700 | $99,600 | $74,100 |
| 2021 | $7,031 | $173,700 | $99,600 | $74,100 |
| 2020 | $6,953 | $173,700 | $99,600 | $74,100 |
| 2019 | $6,786 | $173,700 | $99,600 | $74,100 |
| 2018 | $6,653 | $173,700 | $99,600 | $74,100 |
| 2017 | $6,496 | $173,700 | $99,600 | $74,100 |
| 2016 | $6,337 | $173,700 | $99,600 | $74,100 |
| 2015 | $6,246 | $173,700 | $99,600 | $74,100 |
| 2014 | $6,123 | $173,700 | $99,600 | $74,100 |
Source: Public Records
Map
Nearby Homes
- 72 Burnside Place
- 22 Wanaque Ave
- 59 Carter Rd Unit A2
- 17 Locust St
- 5 Storms Place
- 9116 Warrens Way Unit 116
- 9116 Warrens Way
- 9411 Warrens Way
- 10123 Warrens Way
- 30 Decker Rd
- 10323 Warrens Way
- 8212 Warrens Way
- 8415 Warrens Way
- 1025 Ringwood Ave
- 19 Dogwood Ln Unit 19
- 19 Dogwood Ln Unit U9F
- 23 Dogwood Ln
- 36 Elston Ct
- 43 Elston Ct Unit 301
- 748 Ringwood Ave
Your Personal Tour Guide
Ask me questions while you tour the home.