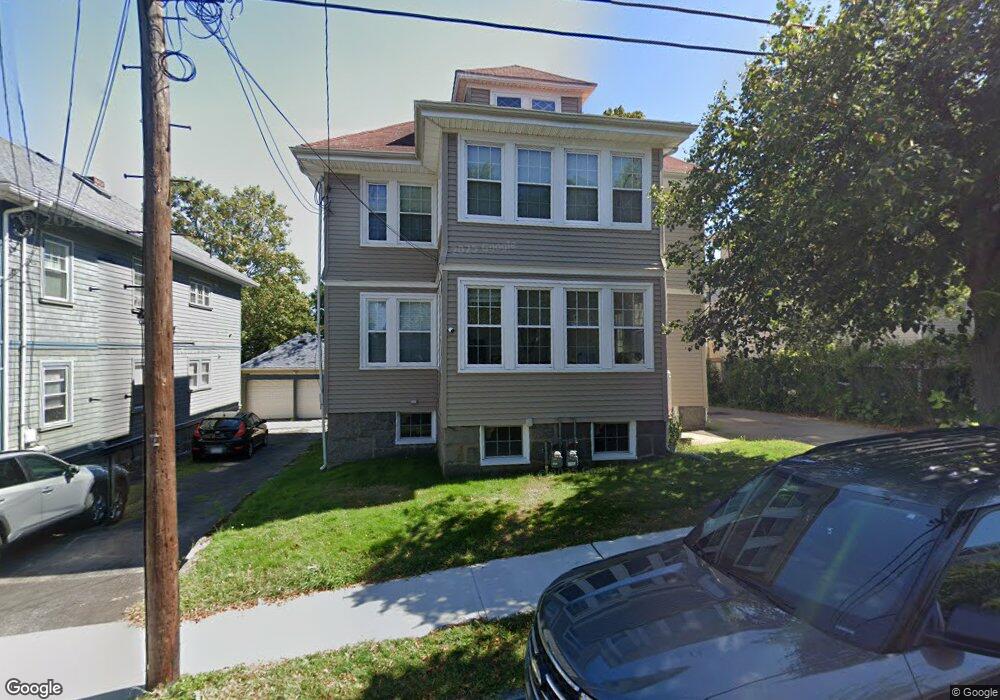
13 Berry St Unit 2 Quincy, MA 02169
Quincy Point NeighborhoodEstimated Value: $812,485 - $982,000
3
Beds
1
Bath
1,262
Sq Ft
$695/Sq Ft
Est. Value
About This Home
This home is located at 13 Berry St Unit 2, Quincy, MA 02169 and is currently estimated at $876,871, approximately $694 per square foot. 13 Berry St Unit 2 is a home located in Norfolk County with nearby schools including Point Webster Middle School, Clifford H. Marshall Elementary School, and Quincy High School.
Ownership History
Date
Name
Owned For
Owner Type
Purchase Details
Closed on
Aug 30, 2002
Sold by
Golden Jean M
Bought by
Lydon Joseph
Current Estimated Value
Home Financials for this Owner
Home Financials are based on the most recent Mortgage that was taken out on this home.
Original Mortgage
$313,900
Outstanding Balance
$134,089
Interest Rate
6.55%
Mortgage Type
Purchase Money Mortgage
Estimated Equity
$742,782
Create a Home Valuation Report for This Property
The Home Valuation Report is an in-depth analysis detailing your home's value as well as a comparison with similar homes in the area
Home Values in the Area
Average Home Value in this Area
Purchase History
| Date | Buyer | Sale Price | Title Company |
|---|---|---|---|
| Lydon Joseph | $392,000 | -- |
Source: Public Records
Mortgage History
| Date | Status | Borrower | Loan Amount |
|---|---|---|---|
| Open | Lydon Joseph | $313,900 |
Source: Public Records
Tax History Compared to Growth
Tax History
| Year | Tax Paid | Tax Assessment Tax Assessment Total Assessment is a certain percentage of the fair market value that is determined by local assessors to be the total taxable value of land and additions on the property. | Land | Improvement |
|---|---|---|---|---|
| 2025 | $9,496 | $823,600 | $262,500 | $561,100 |
| 2024 | $8,855 | $785,700 | $249,900 | $535,800 |
| 2023 | $8,306 | $746,300 | $227,200 | $519,100 |
| 2022 | $8,390 | $700,300 | $206,600 | $493,700 |
| 2021 | $8,559 | $705,000 | $206,600 | $498,400 |
| 2020 | $8,556 | $688,300 | $194,900 | $493,400 |
| 2019 | $8,116 | $646,700 | $180,400 | $466,300 |
| 2018 | $7,516 | $563,400 | $164,000 | $399,400 |
| 2017 | $7,570 | $534,200 | $156,200 | $378,000 |
| 2016 | $6,696 | $466,300 | $142,000 | $324,300 |
| 2015 | $6,444 | $441,400 | $133,900 | $307,500 |
| 2014 | $5,580 | $375,500 | $133,900 | $241,600 |
Source: Public Records
Map
Nearby Homes
- 33 Elm St
- 2 Cliveden St Unit 601E
- 2 Cliveden St Unit 405E
- 81-85 Water St
- 18 Cliveden St Unit 406W
- 18 Cliveden St Unit 201W
- 16 Dartmouth St Unit 16
- 32 Sumner St
- 187 Washington St
- 166 Phipps St
- 51 Sumner St
- 106 Washington St Unit 45
- 50 N Payne St Unit 1
- 50 N Payne St Unit 3
- 59 Spear St Unit 302
- 59 Spear St Unit 301
- 59 Spear St Unit 202
- 66 Mcgrath Hwy Unit 407
- 66 Mcgrath Hwy Unit 405
- 66 Mcgrath Hwy Unit 308
- 13 Berry St
- 17 Berry St
- 17 Berry St Unit 1
- 11 Berry St
- 21 Berry St
- 14 Berry St
- 23 Berry St
- 18 Berry St
- 12 Berry St
- 58 Quincy Ave
- 70 Quincy Ave Unit C
- 70 Quincy Ave Unit B2
- 70 Quincy Ave
- 70 Quincy Ave Unit F
- 60 Quincy Ave
- 22 Berry St
- 22 Berry St Unit 1
- 22 Berry St Unit 22
- 28 Berry St
- 28 Berry St Unit 28