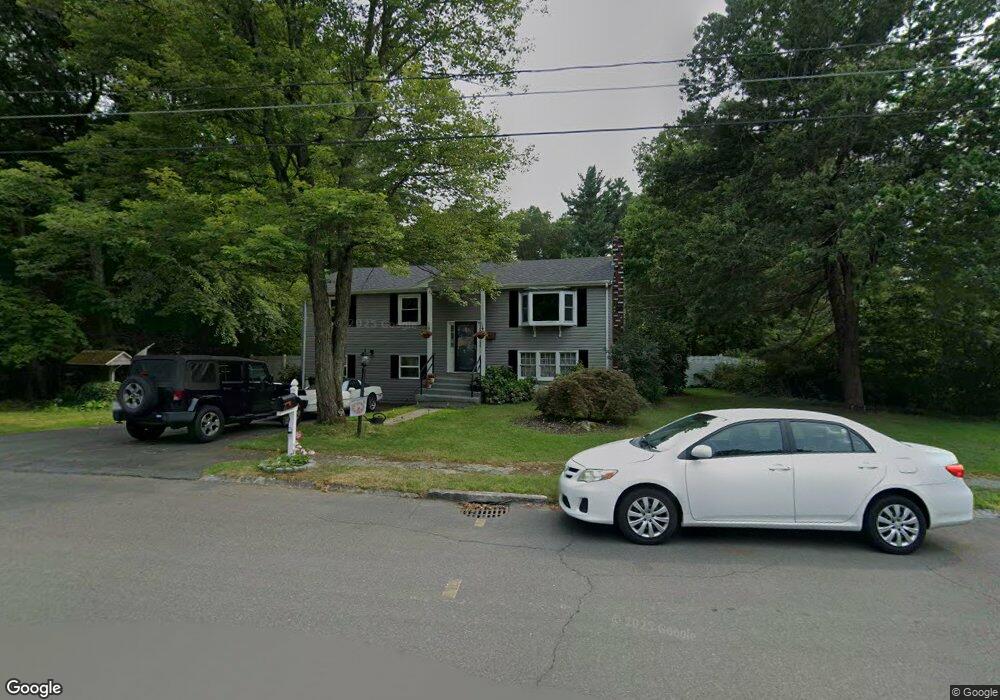
13 Bicknell St Foxboro, MA 02035
Estimated Value: $598,152 - $687,000
3
Beds
2
Baths
1,290
Sq Ft
$512/Sq Ft
Est. Value
About This Home
This home is located at 13 Bicknell St, Foxboro, MA 02035 and is currently estimated at $660,538, approximately $512 per square foot. 13 Bicknell St is a home located in Norfolk County with nearby schools including Foxborough High School, Discovery Daycare Center, and Hands-On-Montessori School.
Ownership History
Date
Name
Owned For
Owner Type
Purchase Details
Closed on
Jul 29, 2005
Sold by
Soper Ronald J
Bought by
Phelan Donna C and Phelan Michael P
Current Estimated Value
Home Financials for this Owner
Home Financials are based on the most recent Mortgage that was taken out on this home.
Original Mortgage
$210,000
Outstanding Balance
$110,387
Interest Rate
5.67%
Mortgage Type
Purchase Money Mortgage
Estimated Equity
$550,151
Purchase Details
Closed on
Nov 16, 1990
Sold by
Lanza Paul J
Bought by
Soper Ronald J
Create a Home Valuation Report for This Property
The Home Valuation Report is an in-depth analysis detailing your home's value as well as a comparison with similar homes in the area
Home Values in the Area
Average Home Value in this Area
Purchase History
| Date | Buyer | Sale Price | Title Company |
|---|---|---|---|
| Phelan Donna C | $382,000 | -- | |
| Soper Ronald J | $160,000 | -- |
Source: Public Records
Mortgage History
| Date | Status | Borrower | Loan Amount |
|---|---|---|---|
| Open | Soper Ronald J | $20,000 | |
| Open | Phelan Donna C | $210,000 | |
| Previous Owner | Soper Ronald J | $122,500 | |
| Previous Owner | Soper Ronald J | $122,800 |
Source: Public Records
Tax History
| Year | Tax Paid | Tax Assessment Tax Assessment Total Assessment is a certain percentage of the fair market value that is determined by local assessors to be the total taxable value of land and additions on the property. | Land | Improvement |
|---|---|---|---|---|
| 2025 | $7,348 | $555,800 | $253,000 | $302,800 |
| 2024 | $7,001 | $518,200 | $257,600 | $260,600 |
| 2023 | $6,815 | $479,600 | $245,200 | $234,400 |
| 2022 | $6,209 | $427,600 | $205,500 | $222,100 |
| 2021 | $5,728 | $388,600 | $190,300 | $198,300 |
| 2020 | $5,360 | $367,900 | $190,300 | $177,600 |
| 2019 | $5,261 | $357,900 | $181,400 | $176,500 |
| 2018 | $5,129 | $352,000 | $181,400 | $170,600 |
| 2017 | $5,099 | $339,000 | $169,400 | $169,600 |
| 2016 | $5,163 | $348,400 | $170,900 | $177,500 |
| 2015 | $4,941 | $325,300 | $144,600 | $180,700 |
| 2014 | $4,734 | $315,800 | $135,100 | $180,700 |
Source: Public Records
Map
Nearby Homes
Your Personal Tour Guide
Ask me questions while you tour the home.