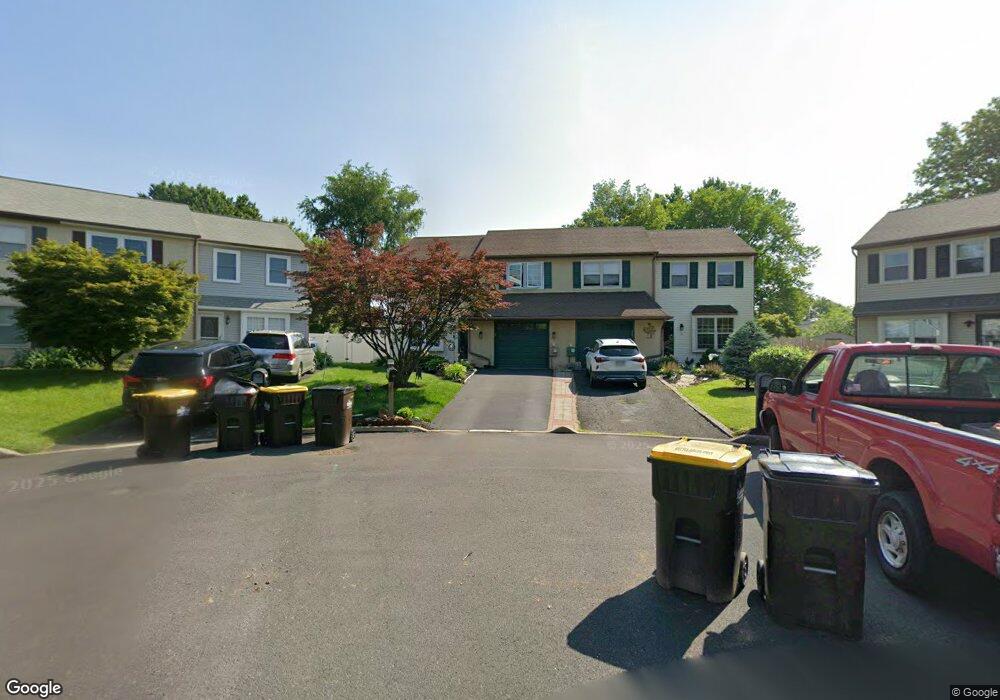
13 Blacksmith Cir Horsham, PA 19044
Estimated Value: $400,886 - $462,000
3
Beds
2
Baths
1,410
Sq Ft
$307/Sq Ft
Est. Value
About This Home
This home is located at 13 Blacksmith Cir, Horsham, PA 19044 and is currently estimated at $432,972, approximately $307 per square foot. 13 Blacksmith Cir is a home located in Montgomery County with nearby schools including Hallowell Elementary School, Keith Valley Middle School, and Hatboro-Horsham Senior High School.
Ownership History
Date
Name
Owned For
Owner Type
Purchase Details
Closed on
Jan 4, 2022
Sold by
Devlin and Michelle
Bought by
Devlin Steven and Devlin Michelle
Current Estimated Value
Home Financials for this Owner
Home Financials are based on the most recent Mortgage that was taken out on this home.
Original Mortgage
$250,000
Outstanding Balance
$214,982
Interest Rate
3.11%
Mortgage Type
New Conventional
Estimated Equity
$217,990
Purchase Details
Closed on
Mar 31, 2011
Sold by
Mcshane Lawrence and Mcshane Rosemarie
Bought by
James Michelle and Devlin Steven
Home Financials for this Owner
Home Financials are based on the most recent Mortgage that was taken out on this home.
Original Mortgage
$236,352
Interest Rate
4.75%
Mortgage Type
FHA
Purchase Details
Closed on
Aug 8, 1996
Sold by
Wong Kwong Yiu and Wong Siu Fong
Bought by
Grundy Gerald and Grundy Rita C
Create a Home Valuation Report for This Property
The Home Valuation Report is an in-depth analysis detailing your home's value as well as a comparison with similar homes in the area
Home Values in the Area
Average Home Value in this Area
Purchase History
| Date | Buyer | Sale Price | Title Company |
|---|---|---|---|
| Devlin Steven | -- | Rosenberg Jay A | |
| James Michelle | $242,500 | None Available | |
| Grundy Gerald | $125,500 | -- |
Source: Public Records
Mortgage History
| Date | Status | Borrower | Loan Amount |
|---|---|---|---|
| Open | Devlin Steven | $250,000 | |
| Previous Owner | James Michelle | $236,352 |
Source: Public Records
Tax History
| Year | Tax Paid | Tax Assessment Tax Assessment Total Assessment is a certain percentage of the fair market value that is determined by local assessors to be the total taxable value of land and additions on the property. | Land | Improvement |
|---|---|---|---|---|
| 2025 | $4,879 | $124,150 | $21,620 | $102,530 |
| 2024 | $4,879 | $124,150 | $21,620 | $102,530 |
| 2023 | $4,644 | $124,150 | $21,620 | $102,530 |
| 2022 | $4,495 | $124,150 | $21,620 | $102,530 |
| 2021 | $4,388 | $124,150 | $21,620 | $102,530 |
| 2020 | $4,285 | $124,150 | $21,620 | $102,530 |
| 2019 | $4,203 | $124,150 | $21,620 | $102,530 |
Source: Public Records
Map
Nearby Homes
- 103 Cobblestone Cir
- 9 Sweet Gum Ln
- 3 Sweet Gum Ln
- 28 Timber Rd
- 26 Brookside Ct Unit 26
- 337 Green Meadow Ln
- 1733 Brittany Dr
- 34 Brookside Ct
- 453 Brown Briar Cir
- 41 Bark Hollow Ln
- 1383 Dawn Dr
- 56 Dogwood Ln Unit D-7
- 52 Dogwood Ln Unit D-9
- 46 Woodbine Ct
- 120 Cypress St
- 1716 Saint Georges Rd
- 4 Beaver Hill Rd
- 410 Walnut Ave
- 410 Avenue D
- 505 Galleria St
- 11 Blacksmith Cir
- 15 Blacksmith Cir
- 17 Blacksmith Cir
- 9 Blacksmith Cir
- 120 Horseshoe Ln
- 119 Horseshoe Ln
- 118 Horseshoe Ln
- 7 Blacksmith Cir
- 19 Blacksmith Cir
- 117 Horseshoe Ln
- 21 Blacksmith Cir
- 116 Horseshoe Ln
- 5 Blacksmith Cir
- 23 Blacksmith Cir
- 115 Horseshoe Ln
- 3 Blacksmith Cir
- 130 Brownstone Ln
- 11 Fieldstone Ln
- 13 Fieldstone Ln
- 9 Fieldstone Ln
Your Personal Tour Guide
Ask me questions while you tour the home.