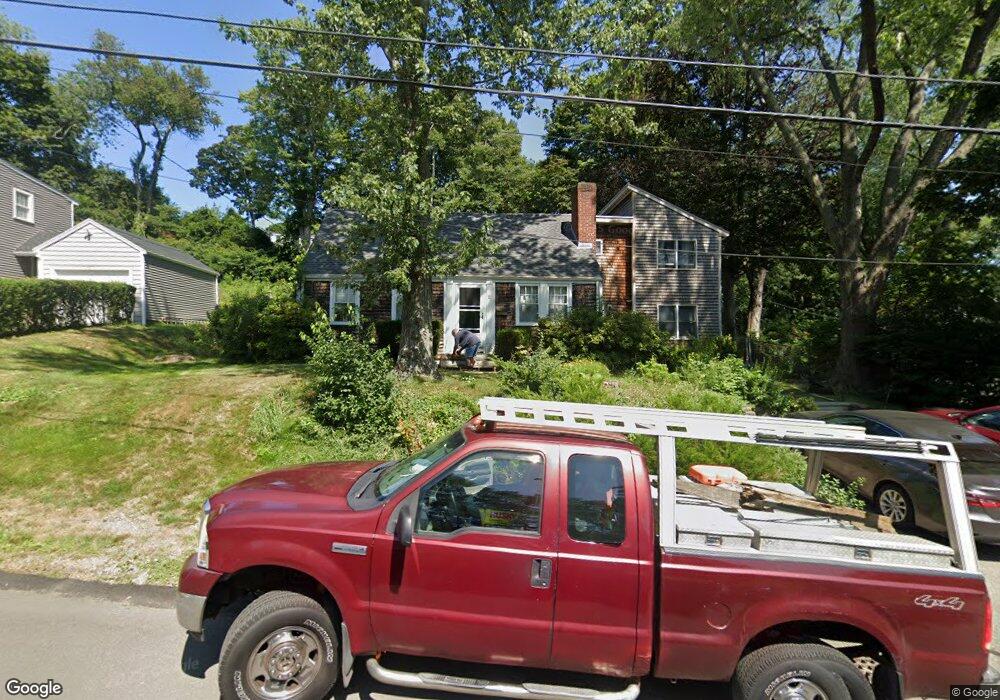
13 Blanchard Blvd Braintree, MA 02184
East Braintree NeighborhoodEstimated Value: $757,000 - $880,000
4
Beds
2
Baths
2,040
Sq Ft
$406/Sq Ft
Est. Value
About This Home
This home is located at 13 Blanchard Blvd, Braintree, MA 02184 and is currently estimated at $827,714, approximately $405 per square foot. 13 Blanchard Blvd is a home located in Norfolk County with nearby schools including Braintree High School, Meeting House Montessori School, and South Shore SDA School.
Ownership History
Date
Name
Owned For
Owner Type
Purchase Details
Closed on
Jan 22, 1993
Sold by
Mcguire Vincent G and Mcguire Nancy M
Bought by
Johnson Julia B
Current Estimated Value
Home Financials for this Owner
Home Financials are based on the most recent Mortgage that was taken out on this home.
Original Mortgage
$128,000
Interest Rate
8.15%
Mortgage Type
Purchase Money Mortgage
Create a Home Valuation Report for This Property
The Home Valuation Report is an in-depth analysis detailing your home's value as well as a comparison with similar homes in the area
Home Values in the Area
Average Home Value in this Area
Purchase History
| Date | Buyer | Sale Price | Title Company |
|---|---|---|---|
| Johnson Julia B | $148,000 | -- | |
| Johnson Julia B | $148,000 | -- |
Source: Public Records
Mortgage History
| Date | Status | Borrower | Loan Amount |
|---|---|---|---|
| Closed | Johnson Julia B | $128,000 |
Source: Public Records
Tax History Compared to Growth
Tax History
| Year | Tax Paid | Tax Assessment Tax Assessment Total Assessment is a certain percentage of the fair market value that is determined by local assessors to be the total taxable value of land and additions on the property. | Land | Improvement |
|---|---|---|---|---|
| 2025 | $7,430 | $744,500 | $425,900 | $318,600 |
| 2024 | $6,760 | $713,100 | $399,300 | $313,800 |
| 2023 | $6,321 | $647,600 | $351,400 | $296,200 |
| 2022 | $6,125 | $615,600 | $319,400 | $296,200 |
| 2021 | $5,364 | $539,100 | $269,400 | $269,700 |
| 2020 | $5,316 | $539,100 | $269,400 | $269,700 |
| 2019 | $5,231 | $518,400 | $269,400 | $249,000 |
| 2018 | $4,982 | $472,700 | $234,300 | $238,400 |
| 2017 | $4,734 | $440,800 | $213,000 | $227,800 |
| 2016 | $4,529 | $412,500 | $191,700 | $220,800 |
| 2015 | $4,420 | $399,300 | $187,400 | $211,900 |
| 2014 | $4,189 | $366,800 | $172,500 | $194,300 |
Source: Public Records
Map
Nearby Homes
- 54 Elmlawn Rd
- 39 Morrison Rd
- 23 Bower Rd
- 11 Rogers Cir
- 106 Home Park Rd
- 102 Conrad St
- 161 Cedar St
- 25 John Paul Cir
- 150 Elm St Unit 1
- 8 Vinton Ave Unit 10
- 205 River St
- 10 Hughes St
- 9 Independence Ave Unit 212
- 39 Dobson Rd
- 218 Independence Ave Unit B
- 391 Commercial St
- 195 Independence Ave Unit 137
- 129 Hayward St
- 171 Hayward St
- 141 Hobart St