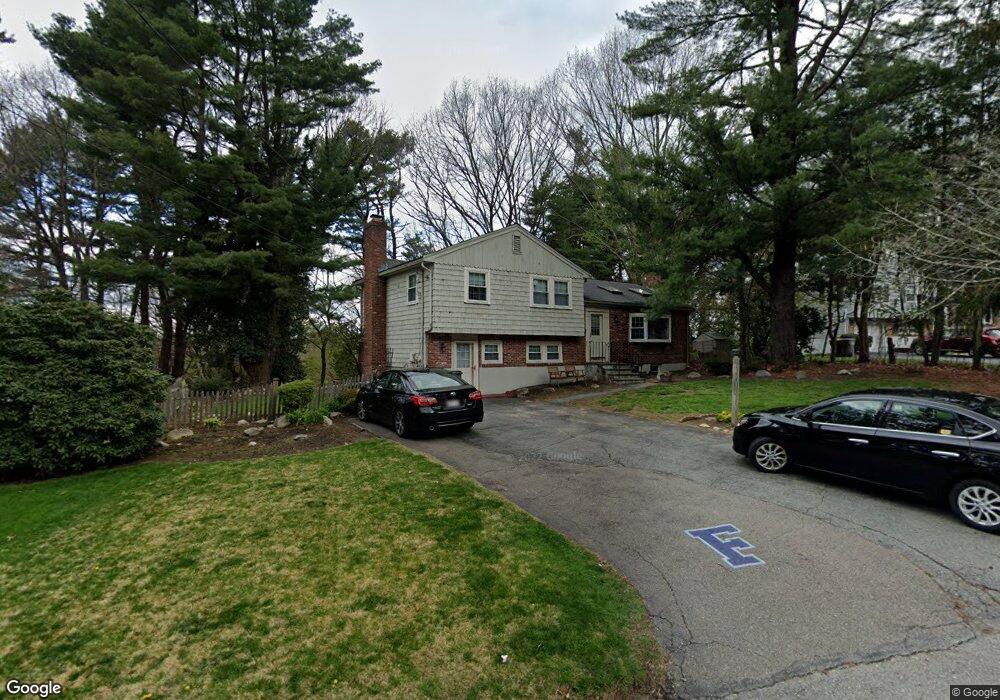
13 Bryant Rd Framingham, MA 01701
Estimated Value: $552,000 - $702,000
3
Beds
2
Baths
1,198
Sq Ft
$519/Sq Ft
Est. Value
About This Home
This home is located at 13 Bryant Rd, Framingham, MA 01701 and is currently estimated at $621,563, approximately $518 per square foot. 13 Bryant Rd is a home located in Middlesex County with nearby schools including Framingham High School, Saint Bridget School, and Happy Hollow School.
Ownership History
Date
Name
Owned For
Owner Type
Purchase Details
Closed on
Oct 10, 2025
Sold by
Tambascio Nicholas J
Bought by
Tambascio Nicholas J and Tambascio Janine
Current Estimated Value
Purchase Details
Closed on
Dec 24, 2018
Sold by
Tambascio Nicholas J and Tambascio Julie A
Bought by
Tambascio Nicholas J
Home Financials for this Owner
Home Financials are based on the most recent Mortgage that was taken out on this home.
Original Mortgage
$335,000
Interest Rate
4.8%
Mortgage Type
Adjustable Rate Mortgage/ARM
Purchase Details
Closed on
Oct 29, 1999
Sold by
Mellone Joseph A and Mellone Kay J
Bought by
Tambascio Nicholas J and Tambascio Julie A
Create a Home Valuation Report for This Property
The Home Valuation Report is an in-depth analysis detailing your home's value as well as a comparison with similar homes in the area
Home Values in the Area
Average Home Value in this Area
Purchase History
| Date | Buyer | Sale Price | Title Company |
|---|---|---|---|
| Tambascio Nicholas J | -- | -- | |
| Tambascio Nicholas J | -- | -- | |
| Tambascio Nicholas J | -- | -- | |
| Tambascio Nicholas J | $240,000 | -- |
Source: Public Records
Mortgage History
| Date | Status | Borrower | Loan Amount |
|---|---|---|---|
| Previous Owner | Tambascio Nicholas J | $335,000 | |
| Previous Owner | Tambascio Nicholas J | $14,459 | |
| Previous Owner | Tambascio Nicholas J | $268,000 |
Source: Public Records
Tax History
| Year | Tax Paid | Tax Assessment Tax Assessment Total Assessment is a certain percentage of the fair market value that is determined by local assessors to be the total taxable value of land and additions on the property. | Land | Improvement |
|---|---|---|---|---|
| 2025 | $6,944 | $581,600 | $269,500 | $312,100 |
| 2024 | $6,637 | $532,700 | $240,700 | $292,000 |
| 2023 | $6,226 | $475,600 | $214,800 | $260,800 |
| 2022 | $5,890 | $428,700 | $195,000 | $233,700 |
| 2021 | $5,761 | $410,000 | $187,400 | $222,600 |
| 2020 | $5,988 | $399,700 | $170,300 | $229,400 |
| 2019 | $5,920 | $384,900 | $170,300 | $214,600 |
| 2018 | $5,846 | $358,200 | $163,900 | $194,300 |
| 2017 | $5,686 | $340,300 | $159,100 | $181,200 |
| 2016 | $5,501 | $316,500 | $159,100 | $157,400 |
| 2015 | $5,383 | $302,100 | $159,900 | $142,200 |
Source: Public Records
Map
Nearby Homes
- 356 Central St
- 111 Indian Head Rd
- 108 Cherry St
- 7 Ballydrain Rd
- 14 Ridgefield Dr
- 231 Central St
- 102 Spruce St
- 30 Donlon St
- Lot 3 Murray Hill Rd
- 1376 Concord St
- 22 Debra Ln
- 342 Old Connecticut Path
- 6 Woodward Rd
- 227 Water St
- 51 Woodland Dr
- 62 Central St
- 46 Cochituate Rd Unit 106
- 56 Greenleaf Cir
- 19 Park Ave
- 447 Old Connecticut Path
Your Personal Tour Guide
Ask me questions while you tour the home.