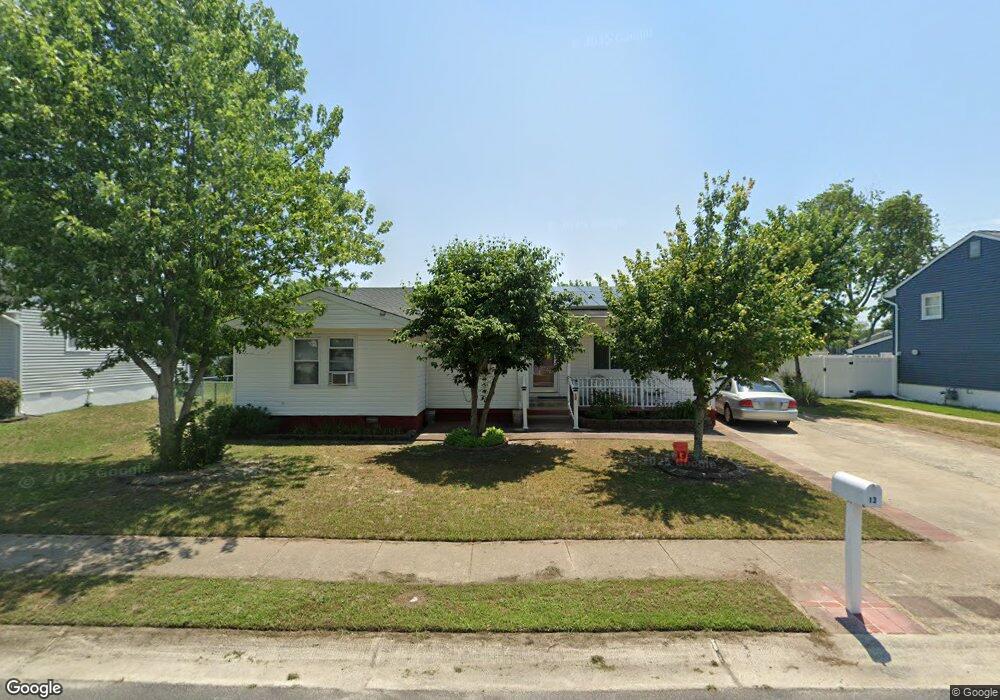
13 Bucknell Rd Somers Point, NJ 08244
Estimated Value: $347,344 - $500,000
Studio
--
Bath
1,750
Sq Ft
$248/Sq Ft
Est. Value
About This Home
This home is located at 13 Bucknell Rd, Somers Point, NJ 08244 and is currently estimated at $434,586, approximately $248 per square foot. 13 Bucknell Rd is a home located in Atlantic County with nearby schools including Mainland Regional High School, ChARTer TECH High School for the Performing Arts, and Saint Joseph Regional School.
Ownership History
Date
Name
Owned For
Owner Type
Purchase Details
Closed on
Apr 1, 2020
Sold by
Ongsuco Alberto M and Ongsuco Maria Teresa
Bought by
Ongsuco Alberto M and Ongsuco Maria Teresa
Current Estimated Value
Home Financials for this Owner
Home Financials are based on the most recent Mortgage that was taken out on this home.
Original Mortgage
$160,000
Outstanding Balance
$141,063
Interest Rate
3.6%
Mortgage Type
New Conventional
Estimated Equity
$293,523
Purchase Details
Closed on
Jun 21, 1993
Sold by
Hennefer William J
Bought by
Ongsuco Alberto M
Create a Home Valuation Report for This Property
The Home Valuation Report is an in-depth analysis detailing your home's value as well as a comparison with similar homes in the area
Home Values in the Area
Average Home Value in this Area
Purchase History
| Date | Buyer | Sale Price | Title Company |
|---|---|---|---|
| Ongsuco Alberto M | -- | Premier T&E Co Inc | |
| Ongsuco Alberto M | $105,000 | -- |
Source: Public Records
Mortgage History
| Date | Status | Borrower | Loan Amount |
|---|---|---|---|
| Open | Ongsuco Alberto M | $160,000 |
Source: Public Records
Tax History
| Year | Tax Paid | Tax Assessment Tax Assessment Total Assessment is a certain percentage of the fair market value that is determined by local assessors to be the total taxable value of land and additions on the property. | Land | Improvement |
|---|---|---|---|---|
| 2025 | $6,977 | $195,100 | $67,500 | $127,600 |
| 2024 | $6,770 | $195,100 | $67,500 | $127,600 |
Source: Public Records
Map
Nearby Homes
Your Personal Tour Guide
Ask me questions while you tour the home.