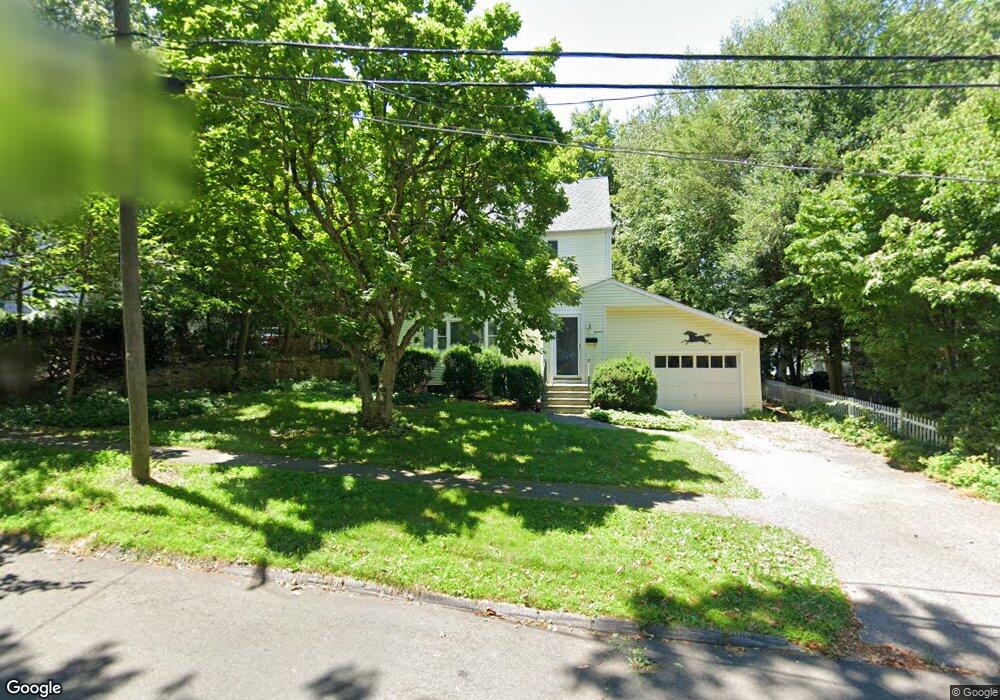
13 Butler St Cos Cob, CT 06807
Estimated Value: $1,383,000 - $1,756,000
3
Beds
2
Baths
1,680
Sq Ft
$910/Sq Ft
Est. Value
About This Home
This home is located at 13 Butler St, Cos Cob, CT 06807 and is currently estimated at $1,527,990, approximately $909 per square foot. 13 Butler St is a home located in Fairfield County with nearby schools including Cos Cob School, Central Middle School, and Greenwich High School.
Ownership History
Date
Name
Owned For
Owner Type
Purchase Details
Closed on
Apr 28, 1978
Bought by
Nacinovich Thomas P and Nacinovich Wilma
Current Estimated Value
Create a Home Valuation Report for This Property
The Home Valuation Report is an in-depth analysis detailing your home's value as well as a comparison with similar homes in the area
Home Values in the Area
Average Home Value in this Area
Purchase History
| Date | Buyer | Sale Price | Title Company |
|---|---|---|---|
| Nacinovich Thomas P | -- | -- |
Source: Public Records
Tax History Compared to Growth
Tax History
| Year | Tax Paid | Tax Assessment Tax Assessment Total Assessment is a certain percentage of the fair market value that is determined by local assessors to be the total taxable value of land and additions on the property. | Land | Improvement |
|---|---|---|---|---|
| 2025 | $8,084 | $654,080 | $518,070 | $136,010 |
| 2024 | $7,807 | $654,080 | $518,070 | $136,010 |
| 2023 | $7,611 | $654,080 | $518,070 | $136,010 |
| 2022 | $7,542 | $654,080 | $518,070 | $136,010 |
| 2021 | $6,696 | $556,150 | $413,770 | $142,380 |
| 2020 | $6,685 | $556,150 | $413,770 | $142,380 |
| 2019 | $6,752 | $556,150 | $413,770 | $142,380 |
| 2018 | $6,602 | $556,150 | $413,770 | $142,380 |
| 2017 | $6,684 | $556,150 | $413,770 | $142,380 |
| 2016 | $6,579 | $556,150 | $413,770 | $142,380 |
| 2015 | $7,155 | $599,970 | $501,970 | $98,000 |
| 2014 | $6,975 | $599,970 | $501,970 | $98,000 |
Source: Public Records
Map
Nearby Homes
- 7 River Rd Unit Boat Slip A-2
- 7 River Rd Unit Boat Slip D-14
- 15 River Rd Unit 210
- 4 Sound Shore Dr Unit 24
- 3 Relay Ct
- 7 Stanwich Rd
- 37 Miltiades Ave
- 24 Valley Rd
- 41 Valley Rd
- 105 Woodside Dr
- 6 Gilliam Ln
- 47 Valley Rd Unit B3
- 40 Bruce Park Dr
- 92 Orchard Dr
- 88 Valleywood Rd
- 24 Harold St Unit E
- 4 Putnam Hill Unit 1D
- 4 Putnam Hill Unit 1C
- 2 Putnam Hill Unit 1F
- 4 Putnam Hill Unit 4