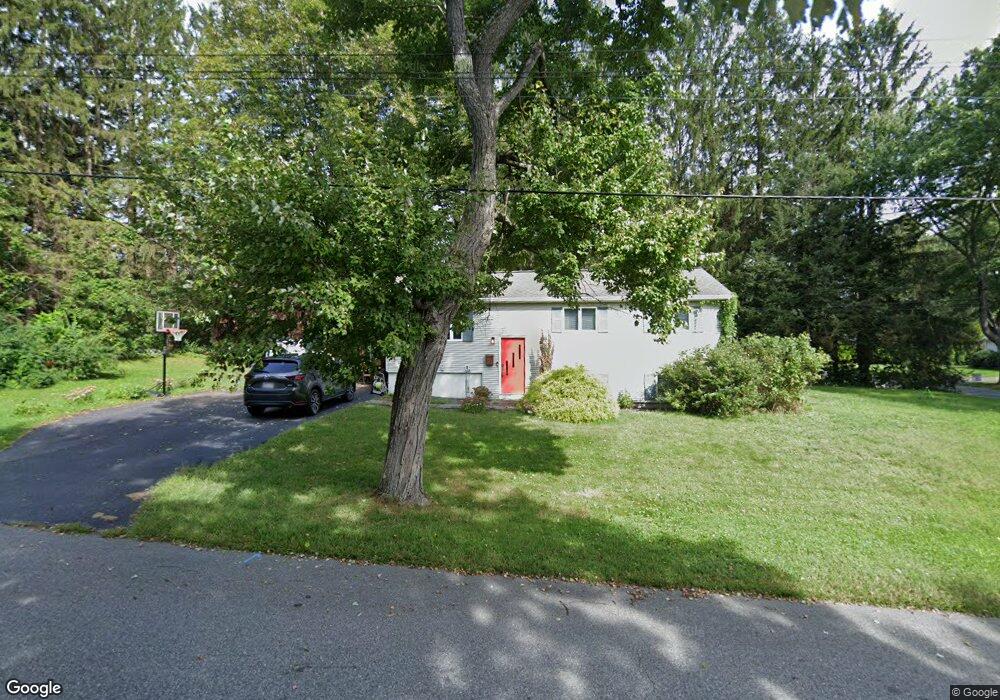
13 Carlton Dr Holliston, MA 01746
Estimated Value: $541,000 - $685,000
3
Beds
1
Bath
1,520
Sq Ft
$403/Sq Ft
Est. Value
About This Home
This home is located at 13 Carlton Dr, Holliston, MA 01746 and is currently estimated at $612,765, approximately $403 per square foot. 13 Carlton Dr is a home located in Middlesex County with nearby schools including Miller Elementary School, Robert H. Adams Middle School, and Holliston High School.
Ownership History
Date
Name
Owned For
Owner Type
Purchase Details
Closed on
May 25, 2007
Sold by
Gile Beth D
Bought by
Frease Jessica and Frease Ryan
Current Estimated Value
Home Financials for this Owner
Home Financials are based on the most recent Mortgage that was taken out on this home.
Original Mortgage
$239,250
Outstanding Balance
$146,321
Interest Rate
6.27%
Mortgage Type
Purchase Money Mortgage
Estimated Equity
$466,444
Purchase Details
Closed on
Mar 17, 1992
Sold by
Green Ethel S
Bought by
Gile Beth D
Create a Home Valuation Report for This Property
The Home Valuation Report is an in-depth analysis detailing your home's value as well as a comparison with similar homes in the area
Home Values in the Area
Average Home Value in this Area
Purchase History
| Date | Buyer | Sale Price | Title Company |
|---|---|---|---|
| Frease Jessica | $319,000 | -- | |
| Gile Beth D | $141,000 | -- |
Source: Public Records
Mortgage History
| Date | Status | Borrower | Loan Amount |
|---|---|---|---|
| Open | Frease Jessica | $239,250 | |
| Previous Owner | Gile Beth D | $9,000 | |
| Previous Owner | Gile Beth D | $125,000 | |
| Previous Owner | Gile Beth D | $127,300 |
Source: Public Records
Tax History Compared to Growth
Tax History
| Year | Tax Paid | Tax Assessment Tax Assessment Total Assessment is a certain percentage of the fair market value that is determined by local assessors to be the total taxable value of land and additions on the property. | Land | Improvement |
|---|---|---|---|---|
| 2025 | $8,371 | $571,400 | $243,700 | $327,700 |
| 2024 | $7,565 | $502,300 | $243,700 | $258,600 |
| 2023 | $7,293 | $473,600 | $243,700 | $229,900 |
| 2022 | $6,914 | $397,800 | $243,700 | $154,100 |
| 2021 | $6,897 | $386,400 | $232,300 | $154,100 |
| 2020 | $6,686 | $354,700 | $209,700 | $145,000 |
| 2019 | $6,530 | $346,800 | $203,500 | $143,300 |
| 2018 | $6,475 | $346,800 | $203,500 | $143,300 |
| 2017 | $6,463 | $349,000 | $207,700 | $141,300 |
| 2016 | $6,169 | $328,300 | $178,400 | $149,900 |
| 2015 | $5,756 | $297,000 | $144,400 | $152,600 |
Source: Public Records
Map
Nearby Homes
- 1037 Washington St
- 1014 Highland St
- 154 Union St
- 1366 Washington St
- 43 Bittersweet Cir Unit 43
- 156 Mitchell Rd
- 160 Winter St
- 11 Francine Dr
- 75 Ridge Rd
- 7 Hill St
- 54 Westfield Dr
- 625 Norfolk St
- 110 Bonney Dr
- 20 Hargrave Ave
- 0 Hill St
- 56 Roy Ave
- 116 Winthrop St
- 266 Willowgate Rise
- 195 High St
- 32 Colonial Way