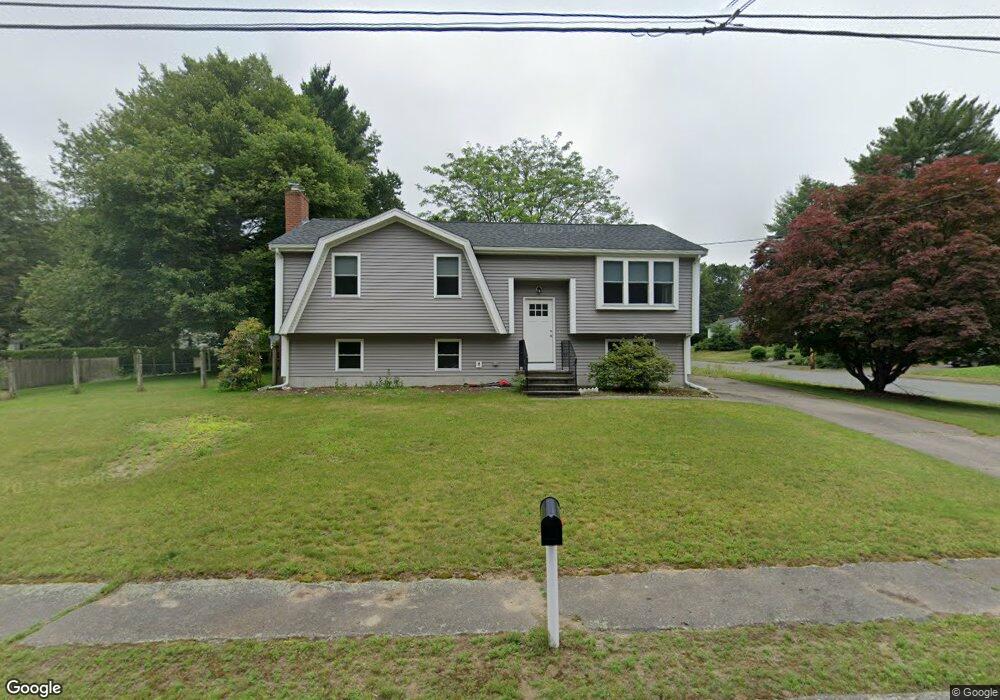
13 Casa Dr Mansfield, MA 02048
Estimated Value: $539,000 - $671,000
3
Beds
1
Bath
1,080
Sq Ft
$533/Sq Ft
Est. Value
About This Home
This home is located at 13 Casa Dr, Mansfield, MA 02048 and is currently estimated at $575,372, approximately $532 per square foot. 13 Casa Dr is a home located in Bristol County with nearby schools including Everett W. Robinson Elementary School, Jordan/Jackson Elementary School, and Harold L. Qualters Middle School.
Ownership History
Date
Name
Owned For
Owner Type
Purchase Details
Closed on
Aug 27, 2024
Sold by
Thistle Louise M
Bought by
13 Casa Dr Rt and Thistle
Current Estimated Value
Purchase Details
Closed on
Mar 4, 2008
Sold by
Thistle Louise M
Bought by
Thistle Louise M
Home Financials for this Owner
Home Financials are based on the most recent Mortgage that was taken out on this home.
Original Mortgage
$126,000
Interest Rate
5.8%
Mortgage Type
Purchase Money Mortgage
Create a Home Valuation Report for This Property
The Home Valuation Report is an in-depth analysis detailing your home's value as well as a comparison with similar homes in the area
Home Values in the Area
Average Home Value in this Area
Purchase History
| Date | Buyer | Sale Price | Title Company |
|---|---|---|---|
| 13 Casa Dr Rt | -- | None Available | |
| 13 Casa Dr Rt | -- | None Available | |
| Thistle Louise M | -- | -- | |
| Thistle Louise M | -- | -- | |
| Thistle Louise M | -- | -- |
Source: Public Records
Mortgage History
| Date | Status | Borrower | Loan Amount |
|---|---|---|---|
| Previous Owner | Thistle Louise M | $126,000 |
Source: Public Records
Tax History
| Year | Tax Paid | Tax Assessment Tax Assessment Total Assessment is a certain percentage of the fair market value that is determined by local assessors to be the total taxable value of land and additions on the property. | Land | Improvement |
|---|---|---|---|---|
| 2025 | $6,590 | $500,400 | $252,000 | $248,400 |
| 2024 | $6,103 | $452,100 | $240,500 | $211,600 |
| 2023 | $5,985 | $424,800 | $240,500 | $184,300 |
| 2022 | $5,807 | $382,800 | $222,700 | $160,100 |
| 2021 | $3,898 | $368,800 | $212,100 | $156,700 |
| 2020 | $5,321 | $346,400 | $185,600 | $160,800 |
| 2019 | $3,309 | $343,900 | $176,800 | $167,100 |
| 2018 | $5,024 | $322,700 | $168,500 | $154,200 |
| 2017 | $0 | $320,700 | $163,600 | $157,100 |
| 2016 | $4,757 | $308,700 | $155,900 | $152,800 |
| 2015 | $4,450 | $287,100 | $155,900 | $131,200 |
Source: Public Records
Map
Nearby Homes
Your Personal Tour Guide
Ask me questions while you tour the home.