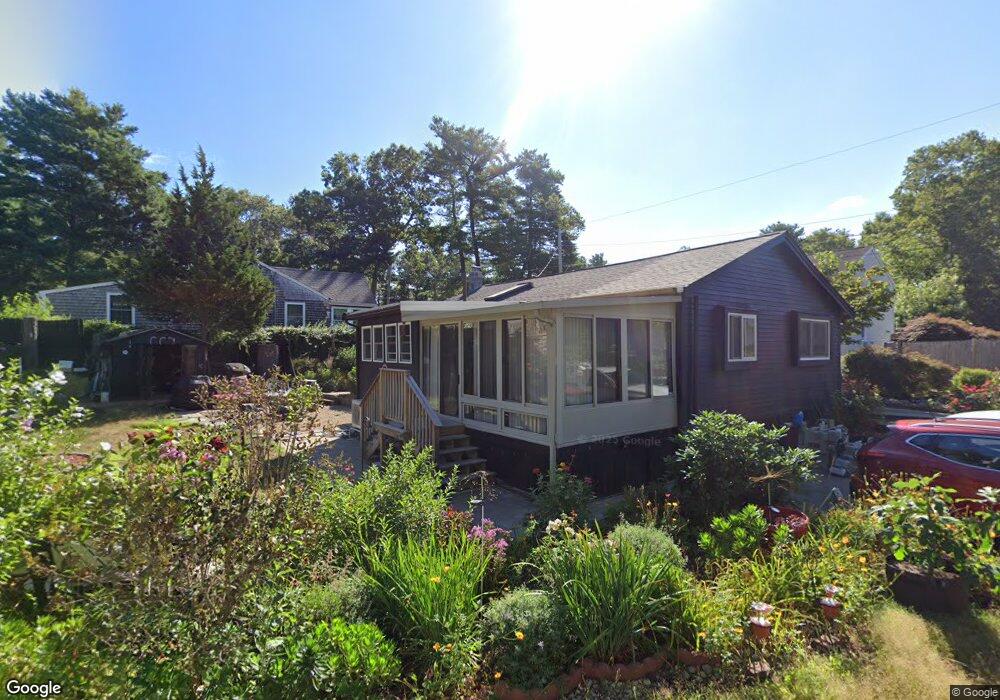
13 Catherine Rd Pembroke, MA 02359
Estimated Value: $360,000 - $460,000
--
Bed
--
Bath
740
Sq Ft
$567/Sq Ft
Est. Value
About This Home
This home is located at 13 Catherine Rd, Pembroke, MA 02359 and is currently estimated at $419,361, approximately $566 per square foot. 13 Catherine Rd is a home with nearby schools including Pembroke High School.
Ownership History
Date
Name
Owned For
Owner Type
Purchase Details
Closed on
Nov 25, 2013
Sold by
Kailher Danielle L
Bought by
Danielle L Kailher Ft and Kailher
Current Estimated Value
Home Financials for this Owner
Home Financials are based on the most recent Mortgage that was taken out on this home.
Original Mortgage
$64,800
Outstanding Balance
$48,950
Interest Rate
4.56%
Mortgage Type
New Conventional
Estimated Equity
$370,411
Purchase Details
Closed on
Oct 28, 2013
Sold by
John A Goodine Lt and Kailher
Bought by
Kailher Danielle L
Home Financials for this Owner
Home Financials are based on the most recent Mortgage that was taken out on this home.
Original Mortgage
$64,800
Outstanding Balance
$48,950
Interest Rate
4.56%
Mortgage Type
New Conventional
Estimated Equity
$370,411
Purchase Details
Closed on
Oct 21, 2013
Sold by
Goodine Therese L
Bought by
John A Goodine Lt and Kailher
Home Financials for this Owner
Home Financials are based on the most recent Mortgage that was taken out on this home.
Original Mortgage
$64,800
Outstanding Balance
$48,950
Interest Rate
4.56%
Mortgage Type
New Conventional
Estimated Equity
$370,411
Create a Home Valuation Report for This Property
The Home Valuation Report is an in-depth analysis detailing your home's value as well as a comparison with similar homes in the area
Home Values in the Area
Average Home Value in this Area
Purchase History
| Date | Buyer | Sale Price | Title Company |
|---|---|---|---|
| Danielle L Kailher Ft | -- | -- | |
| Kailher Danielle L | $81,000 | -- | |
| John A Goodine Lt | -- | -- |
Source: Public Records
Mortgage History
| Date | Status | Borrower | Loan Amount |
|---|---|---|---|
| Open | Kailher Danielle L | $64,800 |
Source: Public Records
Tax History Compared to Growth
Tax History
| Year | Tax Paid | Tax Assessment Tax Assessment Total Assessment is a certain percentage of the fair market value that is determined by local assessors to be the total taxable value of land and additions on the property. | Land | Improvement |
|---|---|---|---|---|
| 2025 | $4,239 | $352,700 | $256,400 | $96,300 |
| 2024 | $3,989 | $331,600 | $236,500 | $95,100 |
| 2023 | $4,218 | $331,600 | $236,500 | $95,100 |
| 2022 | $3,911 | $276,400 | $193,500 | $82,900 |
| 2021 | $3,792 | $260,100 | $184,600 | $75,500 |
| 2020 | $3,651 | $252,000 | $176,300 | $75,700 |
| 2019 | $3,559 | $243,800 | $171,900 | $71,900 |
| 2018 | $3,309 | $222,200 | $154,000 | $68,200 |
| 2017 | $3,228 | $213,800 | $145,600 | $68,200 |
| 2016 | $3,136 | $205,500 | $137,300 | $68,200 |
| 2015 | $2,843 | $192,900 | $124,700 | $68,200 |
Source: Public Records
Map
Nearby Homes