13 Chamone Ave Leonardo, NJ 07737
Estimated Value: $303,000 - $392,316
1
Bed
1
Bath
672
Sq Ft
$528/Sq Ft
Est. Value
About This Home
This home is located at 13 Chamone Ave, Leonardo, NJ 07737 and is currently estimated at $354,829, approximately $528 per square foot. 13 Chamone Ave is a home located in Monmouth County with nearby schools including Leonardo Elementary School, Bayshore Middle School, and Middletown - South High School.
Ownership History
Date
Name
Owned For
Owner Type
Purchase Details
Closed on
Apr 2, 2019
Sold by
Louhier John and Louhier Amy
Bought by
Louhier Amy K
Current Estimated Value
Home Financials for this Owner
Home Financials are based on the most recent Mortgage that was taken out on this home.
Original Mortgage
$40,000
Outstanding Balance
$30,671
Interest Rate
4.3%
Mortgage Type
Stand Alone Second
Estimated Equity
$324,158
Purchase Details
Closed on
Nov 17, 2010
Sold by
Wells Fargo Bank National Association
Bought by
Louhier John and Louhier Amy
Purchase Details
Closed on
Aug 25, 2009
Sold by
Bane Andrew and Burbank Troy
Bought by
Wells Fargo Bank National Association
Purchase Details
Closed on
Oct 4, 2004
Sold by
Ling Sharlene
Bought by
Burban Troy and Bane Andrew
Home Financials for this Owner
Home Financials are based on the most recent Mortgage that was taken out on this home.
Original Mortgage
$107,200
Interest Rate
5.8%
Create a Home Valuation Report for This Property
The Home Valuation Report is an in-depth analysis detailing your home's value as well as a comparison with similar homes in the area
Home Values in the Area
Average Home Value in this Area
Purchase History
| Date | Buyer | Sale Price | Title Company |
|---|---|---|---|
| Louhier Amy K | -- | Fidelity National Ttl Ins Co | |
| Louhier John | $54,900 | Fidelity Natl Title Ins Co | |
| Wells Fargo Bank National Association | -- | None Available | |
| Burban Troy | $134,000 | -- |
Source: Public Records
Mortgage History
| Date | Status | Borrower | Loan Amount |
|---|---|---|---|
| Open | Louhier Amy K | $40,000 | |
| Previous Owner | Burban Troy | $107,200 |
Source: Public Records
Tax History Compared to Growth
Tax History
| Year | Tax Paid | Tax Assessment Tax Assessment Total Assessment is a certain percentage of the fair market value that is determined by local assessors to be the total taxable value of land and additions on the property. | Land | Improvement |
|---|---|---|---|---|
| 2025 | $4,752 | $362,500 | $263,000 | $99,500 |
| 2024 | $4,185 | $288,900 | $191,300 | $97,600 |
| 2023 | $4,185 | $240,800 | $178,800 | $62,000 |
| 2022 | $3,662 | $204,800 | $147,500 | $57,300 |
| 2021 | $3,662 | $176,400 | $125,400 | $51,000 |
| 2020 | $3,575 | $167,200 | $122,400 | $44,800 |
| 2019 | $3,519 | $166,600 | $122,000 | $44,600 |
| 2018 | $2,715 | $125,300 | $82,800 | $42,500 |
| 2017 | $2,714 | $124,000 | $82,800 | $41,200 |
| 2016 | $2,642 | $124,000 | $82,800 | $41,200 |
| 2015 | $2,743 | $124,300 | $82,800 | $41,500 |
| 2014 | $2,731 | $120,700 | $82,800 | $37,900 |
Source: Public Records
Map
Nearby Homes
- 46 Highland Ave
- 17 Washington Ave
- 49 Highland Ave
- 13 Brant Dr Unit Lot 5.09
- 16 Brant Dr Unit Lot 5.08
- 10 Brant Dr Unit Lot 5.05
- 5 Brant Dr Unit Lot 5.13
- 7 Brant Dr Unit Lot 5.12
- 43 Washington Ave
- 4 Brant Dr Unit Lot 5.02
- 41 South Ave
- 58 W Highland Ave
- 11 Brant Dr Unit Lot 5.10
- 28 Florence Ave
- 54 W Washington Ave
- 52 W Highland Ave
- 786 Leonardville Rd
- 7 Harbor View Dr
- 86 Washington Ave
- 59 Florence Ave
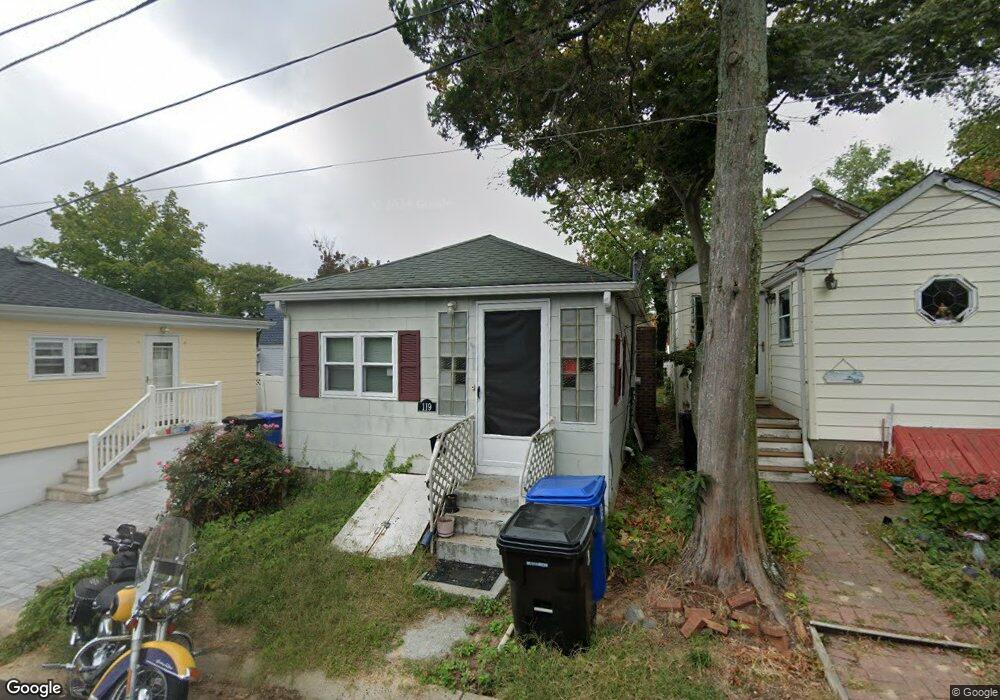
- 119 Chamone Ave
- 117 Chamone Ave
- 17 Hamilton Ave
- 19 Hamilton Ave
- 119 Chamone Ave
- 10 Raritan Ave
- 12 Raritan Ave
- 8 Raritan Ave
- 6 Raritan Ave
- 117 Mabel Ave
- 18 Hamilton Ave
- 113 Mabel Ave
- 4 Raritan Ave
- 121 Mabel Ave
- 20 Hamilton Ave
- 16 Hamilton Ave
- 105 Mabel Ave
- 123 Chamone Ave
- 114 Chamone Ave
- 14 Hamilton Ave