NOT LISTED FOR SALE

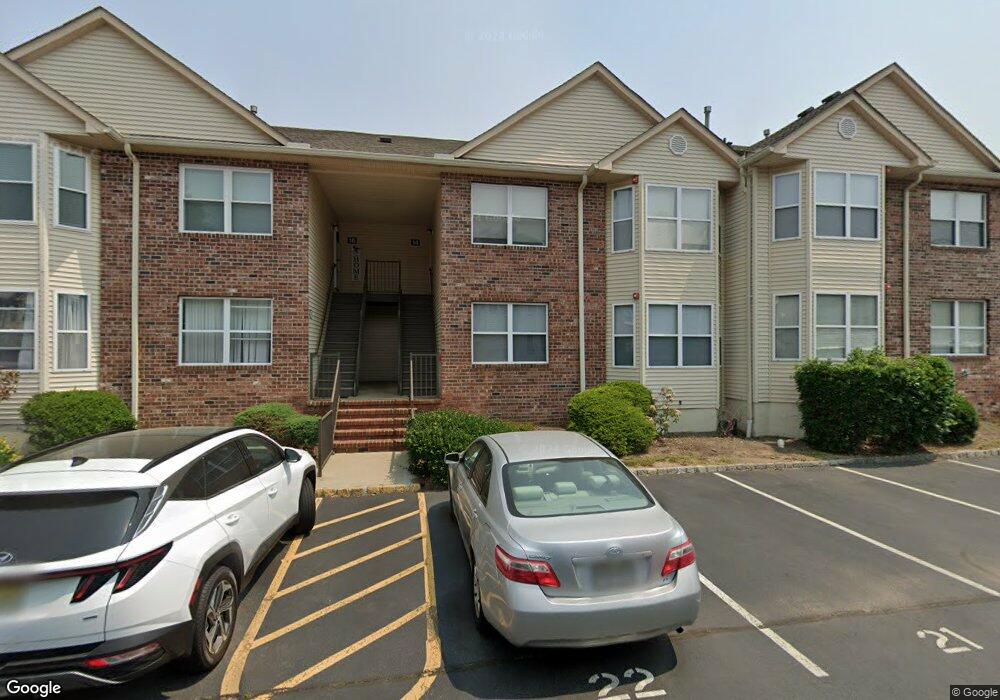
13 Claire Ct East Hanover, NJ 07936

Estimated Value: $447,000 - $568,000

-- Bed
-- Bath
2,926 Sq Ft
$173/Sq Ft Est. Value

About This Home

This home is located at 13 Claire Ct, East Hanover, NJ 07936 and is currently estimated at $506,593, approximately $173 per square foot. 13 Claire Ct is a home located in Morris County with nearby schools including Frank J. Smith Elementary School, Central Elementary School, and East Hanover Middle School.

Ownership History

Date Name Owned For Owner Type

Purchase Details

Closed on
Mar 8, 2006
Sold by
Pietrointo Maria
Bought by
Pietropinto Maria
Current Estimated Value
$506,593

Purchase Details

Closed on
May 29, 1997
Sold by
Hoang Jim
Bought by
Pietropinto Amelia

Home Financials for this Owner

Home Financials are based on the most recent Mortgage that was taken out on this home.
Original Mortgage
$135,000
Interest Rate
7%

Purchase Details

Closed on
Jun 19, 1995
Sold by
Langer Dov
Bought by
Hoang Jim

Purchase Details

Closed on
Jan 28, 1994
Sold by
Hanover Park Inc
Bought by
Langer Dov

Home Financials for this Owner

Home Financials are based on the most recent Mortgage that was taken out on this home.
Original Mortgage
$98,000
Interest Rate
7.18%

Range of Values:

Collateral Analytics

Collateral Analytics Collateral Analytics AVMs (Automated Valuation Model) employ a number of statistical approaches combined with neighborhood-specific comparable selection guarantees the most up-to-date and precise valuations.

Not Available

Collateral Analytics does not have data for the current month. Please view the chart for historical values.

ICE

ICE Mortgage Technology ICE Mortgage Technology’s AVM (Automated Valuation Model) is a state-of-the-art online residential property valuation tool that provides a quick and accurate estimate of the value of almost any home in the U.S.

Not Available

ICE Mortgage Technology does not have data for the current month. Please view the chart for historical values.

First American

First American First American Data & Analytics’ next-generation AVM combines unrivaled data assets with a blended ensemble of valuation models to produce highly accurate, reliable valuations you can trust.

Not Available

First American does not have data for the current month. Please view the chart for historical values.

Quantarium

Quantarium Quantarium’s valuation service, repeatedly proven the industry’s most accurate and comprehensive, is supercharged with a self-learning and auto-tuning AI engine that continually becomes smarter and more accurate as it processes daily inputs from the industry’s leading RE data lake.

Not Available

Quantarium does not have data for the current month. Please view the chart for historical values.

Average Value
Not Available
List Price
Sold Price
Create a Home Valuation Report for This Property
The Home Valuation Report is an in-depth analysis detailing your home's value as well as a comparison with similar homes in the area

Home Values in the Area

Source: Public Records

Average Home Value in this Area


Source: Public Records

Purchase History

Date Buyer Sale Price Title Company
Pietropinto Maria -- --
Pietropinto Amelia $184,000 Chicago Title Insurance Co
Hoang Jim $164,000 --
Langer Dov $139,900 --
Source: Public Records

Mortgage History

Date Status Borrower Loan Amount
Open Pietropinto Maria $150,000
Previous Owner Pietropinto Amelia $135,000
Previous Owner Langer Dov $98,000
Source: Public Records

Tax History Compared to Growth

Source: Public Records

Tax History

Year Tax Paid Tax Assessment Tax Assessment Total Assessment is a certain percentage of the fair market value that is determined by local assessors to be the total taxable value of land and additions on the property. Land Improvement
2024 $6,240 $250,100 $95,000 $155,100
2023 $6,240 $250,100 $95,000 $155,100
2022 $5,602 $250,100 $95,000 $155,100
2021 $5,602 $250,100 $95,000 $155,100
2020 $5,977 $250,100 $95,000 $155,100
2019 $5,867 $250,100 $95,000 $155,100
2018 $5,690 $250,100 $95,000 $155,100
2017 $5,505 $250,100 $95,000 $155,100
2016 $5,430 $250,100 $95,000 $155,100
2015 $5,352 $250,100 $95,000 $155,100
2014 $5,237 $250,100 $95,000 $155,100
Source: Public Records

Map