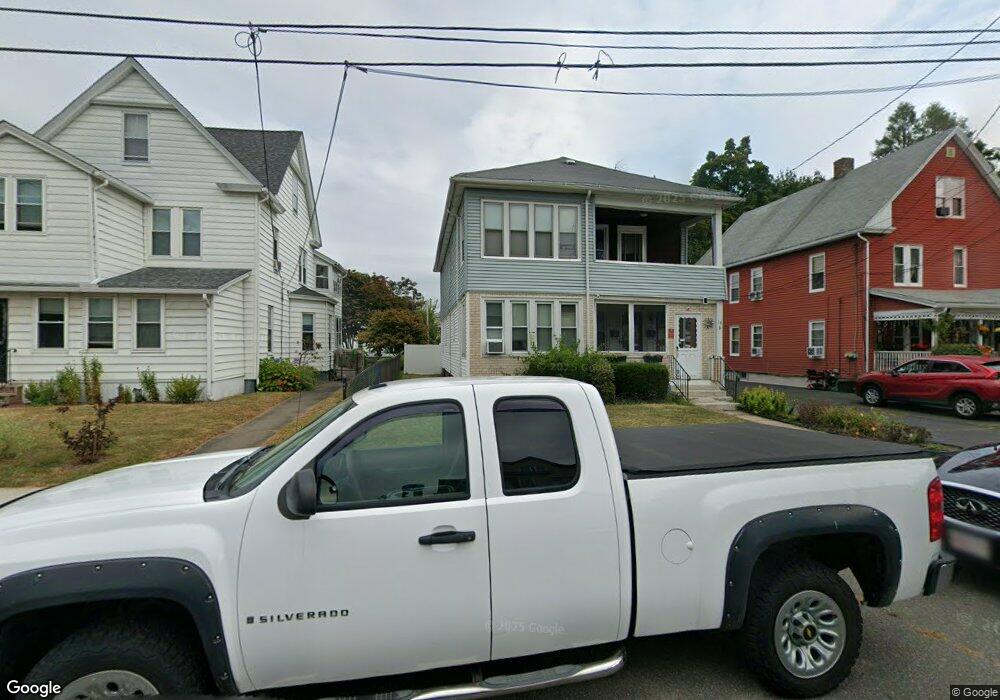
13 Clark St Holyoke, MA 01040
Estimated Value: $342,422 - $394,000
4
Beds
2
Baths
2,448
Sq Ft
$149/Sq Ft
Est. Value
About This Home
This home is located at 13 Clark St, Holyoke, MA 01040 and is currently estimated at $364,606, approximately $148 per square foot. 13 Clark St is a home located in Hampden County with nearby schools including Maurice A. Donahue Elementary School, Holyoke High School, and Holyoke Community Charter School.
Ownership History
Date
Name
Owned For
Owner Type
Purchase Details
Closed on
Jun 20, 2008
Sold by
Gaughan Rina B
Bought by
Barta Abelardo R
Current Estimated Value
Home Financials for this Owner
Home Financials are based on the most recent Mortgage that was taken out on this home.
Original Mortgage
$147,070
Outstanding Balance
$94,615
Interest Rate
6.1%
Mortgage Type
Purchase Money Mortgage
Estimated Equity
$269,991
Purchase Details
Closed on
May 4, 2007
Sold by
Pollender-Calcinari C
Bought by
Gaughan Daniel J and Gaughan Rina B
Create a Home Valuation Report for This Property
The Home Valuation Report is an in-depth analysis detailing your home's value as well as a comparison with similar homes in the area
Home Values in the Area
Average Home Value in this Area
Purchase History
| Date | Buyer | Sale Price | Title Company |
|---|---|---|---|
| Barta Abelardo R | $191,000 | -- | |
| Gaughan Daniel J | -- | -- |
Source: Public Records
Mortgage History
| Date | Status | Borrower | Loan Amount |
|---|---|---|---|
| Open | Barta Abelardo R | $147,070 |
Source: Public Records
Tax History Compared to Growth
Tax History
| Year | Tax Paid | Tax Assessment Tax Assessment Total Assessment is a certain percentage of the fair market value that is determined by local assessors to be the total taxable value of land and additions on the property. | Land | Improvement |
|---|---|---|---|---|
| 2025 | $5,198 | $297,700 | $47,600 | $250,100 |
| 2024 | $4,819 | $254,300 | $45,500 | $208,800 |
| 2023 | $4,450 | $237,200 | $45,500 | $191,700 |
| 2022 | $4,470 | $232,100 | $45,500 | $186,600 |
| 2021 | $2,724 | $201,700 | $41,500 | $160,200 |
| 2020 | $3,612 | $189,300 | $41,500 | $147,800 |
| 2019 | $2,587 | $183,600 | $41,500 | $142,100 |
| 2018 | $1,524 | $173,600 | $41,500 | $132,100 |
| 2017 | $6,858 | $173,600 | $41,500 | $132,100 |
| 2016 | $3,231 | $169,000 | $42,600 | $126,400 |
| 2015 | $3,218 | $169,000 | $42,600 | $126,400 |
Source: Public Records
Map
Nearby Homes