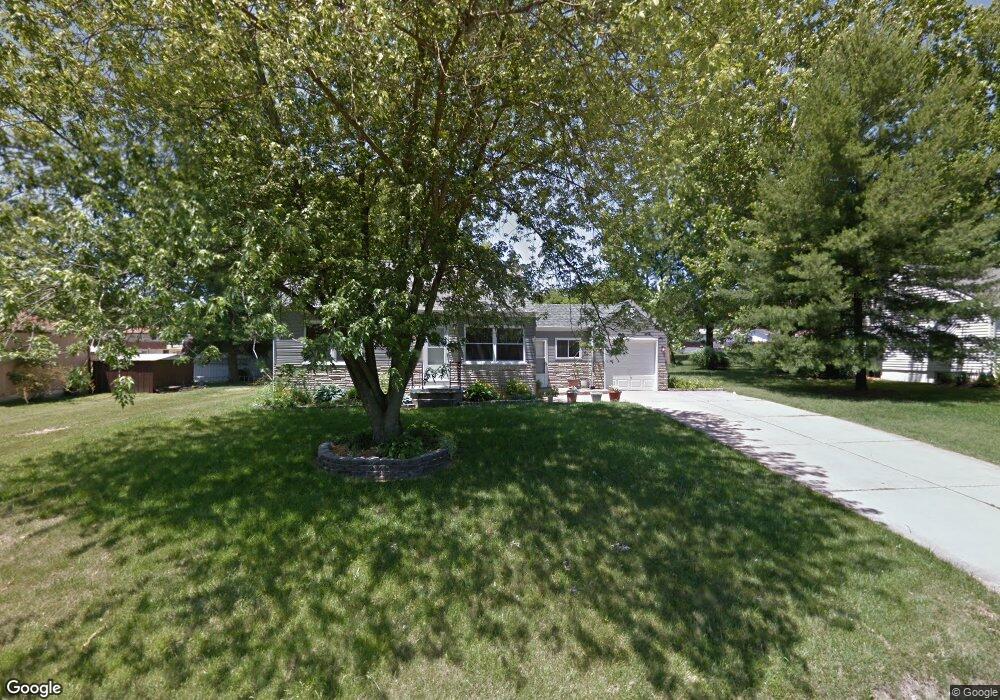
13 Cliff Dr Saint Louis, MO 63125
Mehlville NeighborhoodEstimated Value: $186,241 - $225,000
2
Beds
1
Bath
858
Sq Ft
$238/Sq Ft
Est. Value
About This Home
This home is located at 13 Cliff Dr, Saint Louis, MO 63125 and is currently estimated at $203,810, approximately $237 per square foot. 13 Cliff Dr is a home located in St. Louis County with nearby schools including Forder Elementary School, Margaret Buerkle Middle School, and Mehlville High School.
Ownership History
Date
Name
Owned For
Owner Type
Purchase Details
Closed on
Nov 28, 2023
Sold by
Rauch Thomas D
Bought by
Rauch Cherish M
Current Estimated Value
Purchase Details
Closed on
Jun 15, 2015
Sold by
Manes Peggy
Bought by
Rauch Thomas D
Purchase Details
Closed on
Mar 14, 2014
Sold by
Manes Peggy
Bought by
Manes Peggy L
Home Financials for this Owner
Home Financials are based on the most recent Mortgage that was taken out on this home.
Original Mortgage
$87,500
Interest Rate
4.27%
Mortgage Type
New Conventional
Purchase Details
Closed on
Feb 25, 1999
Sold by
Wood Kenneth P
Bought by
Manes Peggy
Home Financials for this Owner
Home Financials are based on the most recent Mortgage that was taken out on this home.
Original Mortgage
$78,000
Interest Rate
6.8%
Create a Home Valuation Report for This Property
The Home Valuation Report is an in-depth analysis detailing your home's value as well as a comparison with similar homes in the area
Home Values in the Area
Average Home Value in this Area
Purchase History
| Date | Buyer | Sale Price | Title Company |
|---|---|---|---|
| Rauch Cherish M | -- | None Listed On Document | |
| Rauch Thomas D | -- | Continental Title Company | |
| Manes Peggy L | -- | None Available | |
| Manes Peggy | $87,000 | -- |
Source: Public Records
Mortgage History
| Date | Status | Borrower | Loan Amount |
|---|---|---|---|
| Previous Owner | Manes Peggy L | $87,500 | |
| Previous Owner | Manes Peggy | $78,000 |
Source: Public Records
Tax History Compared to Growth
Tax History
| Year | Tax Paid | Tax Assessment Tax Assessment Total Assessment is a certain percentage of the fair market value that is determined by local assessors to be the total taxable value of land and additions on the property. | Land | Improvement |
|---|---|---|---|---|
| 2025 | $1,978 | $37,030 | $20,580 | $16,450 |
| 2024 | $1,978 | $29,250 | $11,310 | $17,940 |
| 2023 | $1,953 | $29,250 | $11,310 | $17,940 |
| 2022 | $1,708 | $25,660 | $11,310 | $14,350 |
| 2021 | $1,653 | $25,660 | $11,310 | $14,350 |
| 2020 | $1,616 | $23,850 | $13,110 | $10,740 |
| 2019 | $1,611 | $23,850 | $13,110 | $10,740 |
| 2018 | $1,379 | $18,380 | $7,510 | $10,870 |
| 2017 | $1,377 | $18,380 | $7,510 | $10,870 |
| 2016 | $1,316 | $16,840 | $5,400 | $11,440 |
| 2015 | $1,210 | $16,840 | $5,400 | $11,440 |
| 2014 | $1,191 | $16,400 | $5,970 | $10,430 |
Source: Public Records
Map
Nearby Homes
- 701 Chevron Dr
- 3151 Lin Tel Rd
- 3105 Lin Tel Rd
- 2907 Hubert Dr
- 725 Buckley Rd
- 851 Poplar Dr
- 2825 Telegraph Rd
- 4061 Morningview Ct
- 929 Peace Haven Dr
- 2745 Granda Dr
- 1104 Brookville Ct
- 2669 Jonathan Dr
- 2808 Westlawn St
- 205 Grover Rd
- 669 Bellsworth Dr
- 517 Aqua Ridge Dr
- 121 Jefferson Barracks Rd
- 660 Rochester Dr
- 2959 Annunciation Dr
- 32 Buckley Meadows Dr