13 Clinton St Staten Island, NY 10304
Tompkinsville NeighborhoodEstimated Value: $1,108,532
--
Bed
--
Bath
3,664
Sq Ft
$303/Sq Ft
Est. Value
About This Home
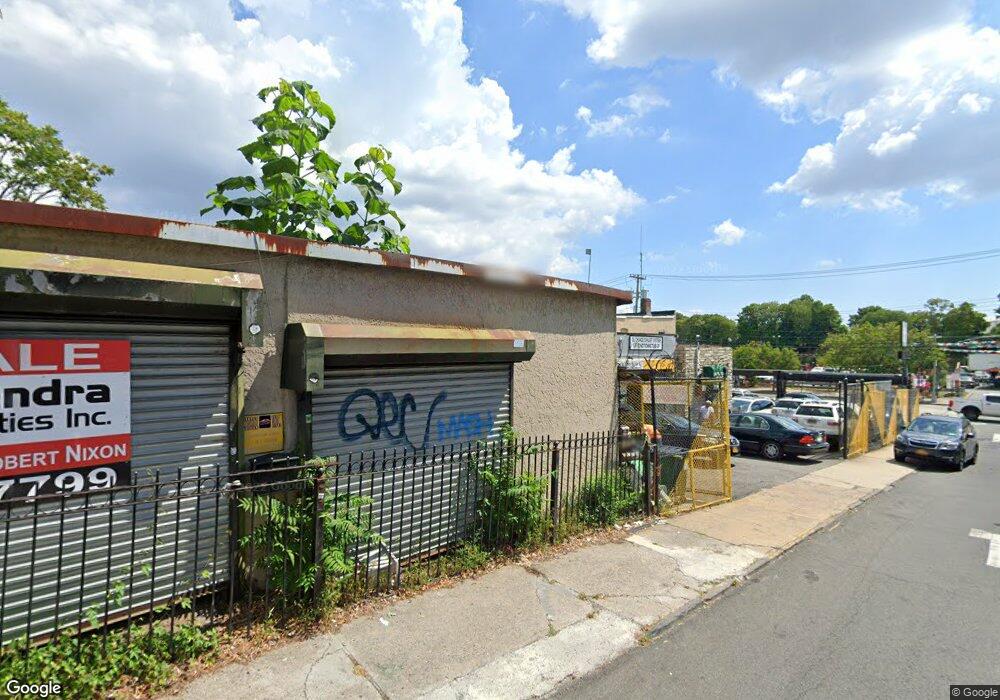
This home is located at 13 Clinton St, Staten Island, NY 10304 and is currently estimated at $1,108,532, approximately $302 per square foot. 13 Clinton St is a home located in Richmond County with nearby schools including P.S. 16 John J Driscoll, P.S. 74 Future Leaders Elementary School, and Fort Hill Collaborative Elementary.
Ownership History
Date
Name
Owned For
Owner Type
Purchase Details
Closed on
Feb 8, 2020
Sold by
Guide Connection Inc
Bought by
13 Clinton Street Llc
Current Estimated Value
Purchase Details
Closed on
Jul 6, 2011
Sold by
Atmaca Adam and Atmaca Muharrem
Bought by
Guide Connection Inc
Home Financials for this Owner
Home Financials are based on the most recent Mortgage that was taken out on this home.
Original Mortgage
$499,999
Interest Rate
4.49%
Mortgage Type
Commercial
Purchase Details
Closed on
Jun 5, 2008
Sold by
Glak Holding Corp
Bought by
Atmaca Adam and Atmaca Muharrem
Home Financials for this Owner
Home Financials are based on the most recent Mortgage that was taken out on this home.
Original Mortgage
$450,000
Interest Rate
7%
Mortgage Type
Seller Take Back
Purchase Details
Closed on
May 5, 2006
Sold by
Reig John V
Bought by
Glak Holding Corp
Create a Home Valuation Report for This Property
The Home Valuation Report is an in-depth analysis detailing your home's value as well as a comparison with similar homes in the area
Home Values in the Area
Average Home Value in this Area
Purchase History
| Date | Buyer | Sale Price | Title Company |
|---|---|---|---|
| 13 Clinton Street Llc | -- | Heights Abstract Ltd | |
| Guide Connection Inc | $600,000 | None Available | |
| Atmaca Adam | $600,000 | None Available | |
| Glak Holding Corp | $500,000 | Ticor Title Insurance Co |
Source: Public Records
Mortgage History
| Date | Status | Borrower | Loan Amount |
|---|---|---|---|
| Previous Owner | Guide Connection Inc | $499,999 | |
| Previous Owner | Atmaca Adam | $450,000 |
Source: Public Records
Tax History Compared to Growth
Tax History
| Year | Tax Paid | Tax Assessment Tax Assessment Total Assessment is a certain percentage of the fair market value that is determined by local assessors to be the total taxable value of land and additions on the property. | Land | Improvement |
|---|---|---|---|---|
| 2025 | $10,009 | $115,200 | $86,040 | $29,160 |
| 2024 | $10,009 | $106,200 | $84,330 | $21,870 |
| 2023 | $9,572 | $89,910 | $80,820 | $9,090 |
| 2022 | $9,196 | $91,800 | $87,750 | $4,050 |
| 2021 | $8,701 | $83,700 | $79,200 | $4,500 |
| 2020 | $28,468 | $88,200 | $79,200 | $9,000 |
| 2019 | $15,895 | $83,250 | $70,200 | $13,050 |
| 2018 | $7,627 | $80,550 | $61,650 | $18,900 |
| 2017 | $7,343 | $71,100 | $47,250 | $23,850 |
| 2016 | $7,747 | $75,150 | $47,250 | $27,900 |
| 2015 | $6,922 | $68,850 | $47,250 | $21,600 |
| 2014 | $6,922 | $67,050 | $47,250 | $19,800 |
Source: Public Records
Map
Nearby Homes