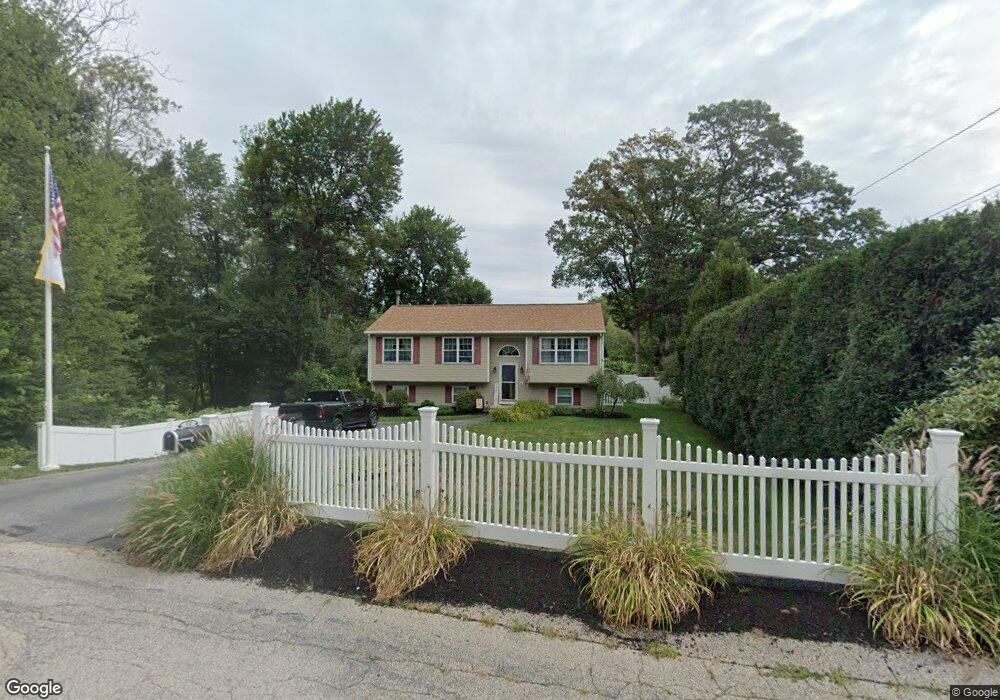
13 Cote Ct Coventry, RI 02816
Estimated Value: $442,000 - $491,000
3
Beds
1
Bath
1,092
Sq Ft
$426/Sq Ft
Est. Value
About This Home
This home is located at 13 Cote Ct, Coventry, RI 02816 and is currently estimated at $464,880, approximately $425 per square foot. 13 Cote Ct is a home located in Kent County with nearby schools including Alan Shawn Feinstein Ms Of Cov, Coventry High School, and Father John V. Doyle School.
Ownership History
Date
Name
Owned For
Owner Type
Purchase Details
Closed on
Oct 17, 2018
Sold by
Stalaboin Joseph T and Stalaboin Kim-Marie S
Bought by
Stalaboin Lt
Current Estimated Value
Purchase Details
Closed on
Jun 23, 2000
Sold by
Tristar Construction
Bought by
Stalaboin Joseph T and S-Stalaboin Kim Marie
Purchase Details
Closed on
Apr 11, 2000
Sold by
Fascio Donald R and Fascio Ann Marie
Bought by
Tri Star Construction
Create a Home Valuation Report for This Property
The Home Valuation Report is an in-depth analysis detailing your home's value as well as a comparison with similar homes in the area
Purchase History
| Date | Buyer | Sale Price | Title Company |
|---|---|---|---|
| Stalaboin Lt | -- | -- | |
| Stalaboin Joseph T | $142,500 | -- | |
| Tri Star Construction | $27,500 | -- |
Source: Public Records
Mortgage History
| Date | Status | Borrower | Loan Amount |
|---|---|---|---|
| Previous Owner | Tri Star Construction | $171,738 | |
| Previous Owner | Tri Star Construction | $40,000 | |
| Previous Owner | Tri Star Construction | $130,000 |
Source: Public Records
Tax History
| Year | Tax Paid | Tax Assessment Tax Assessment Total Assessment is a certain percentage of the fair market value that is determined by local assessors to be the total taxable value of land and additions on the property. | Land | Improvement |
|---|---|---|---|---|
| 2025 | $5,318 | $330,500 | $97,800 | $232,700 |
| 2024 | $5,276 | $333,100 | $97,800 | $235,300 |
| 2023 | $5,106 | $333,100 | $97,800 | $235,300 |
| 2022 | $4,953 | $253,100 | $94,000 | $159,100 |
| 2021 | $4,910 | $253,100 | $94,000 | $159,100 |
| 2020 | $5,629 | $253,100 | $94,000 | $159,100 |
| 2019 | $4,922 | $221,300 | $78,900 | $142,400 |
| 2018 | $4,782 | $221,300 | $78,900 | $142,400 |
| 2017 | $4,643 | $221,300 | $78,900 | $142,400 |
| 2016 | $4,068 | $190,000 | $65,700 | $124,300 |
| 2015 | $3,958 | $190,000 | $65,700 | $124,300 |
| 2014 | $3,691 | $190,000 | $65,700 | $124,300 |
| 2013 | $3,900 | $209,000 | $74,300 | $134,700 |
Source: Public Records
Map
Nearby Homes
- 27 Matteson St
- 91 Windsor Park Dr
- 32 Pilgrim Ave
- 1 Pettine St
- 21 Darton St
- 185 Pulaski St
- 31 Anthony St Unit 33
- 123 Doolittle St
- 22 Rawlinson Dr
- 16 Morris St
- 131 Pawtuxet Terrace
- 58 Read Ave
- 22 Colorado St
- 37 West St
- 0 Beaulieu Ave
- 11 Kennedy Dr
- 168 Knotty Oak Rd
- 275 E Shore Dr
- 251 E Shore Dr
- 22 Wood St
- 46 Sheltra Ave
- 43 Cote Ct
- 38 Sheltra Ave
- 44 Sheltra Ave
- 48 Sheltra Ave
- 32 Sheltra Ave
- 12 Cote Ct
- 14 Cote Ct
- 50 Sheltra Ave
- 33 Sheltra Ave
- 80 Sheltra Ave
- 45 Sheltra Ave
- 29 Sheltra Ave
- 78 Sheltra Ave
- 18 Sheltra Ave
- 51 Sheltra Ave
- 0 Cote Ct Unit 618785
- 0 Cote Ct Unit 623333
- 0 Cote Ct Unit 811593
- 0 Cote Ct Unit 1242699
Your Personal Tour Guide
Ask me questions while you tour the home.