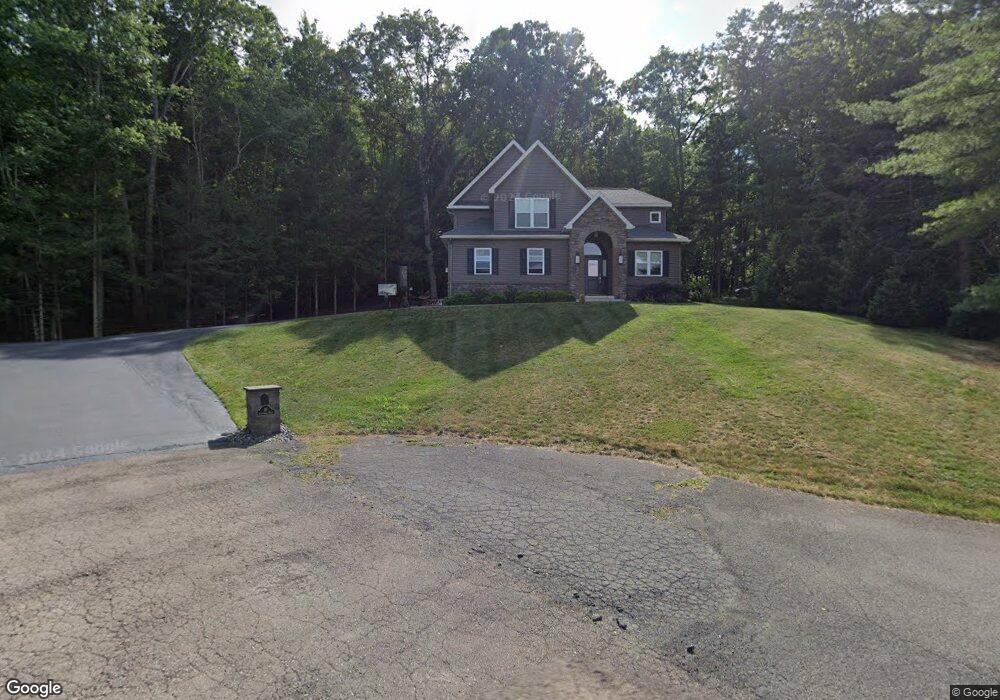
13 Crestwood Rd South Corning, NY 14830
Estimated Value: $477,000 - $500,338
4
Beds
4
Baths
3,063
Sq Ft
$160/Sq Ft
Est. Value
About This Home
This home is located at 13 Crestwood Rd, South Corning, NY 14830 and is currently estimated at $488,835, approximately $159 per square foot. 13 Crestwood Rd is a home located in Steuben County with nearby schools including William E. Severn Elementary School, Corning-Painted Post Middle School, and Corning-Painted Post High School.
Ownership History
Date
Name
Owned For
Owner Type
Purchase Details
Closed on
Aug 30, 2023
Sold by
Scott James A and Scott Jodie A
Bought by
Conneely Shane and Conneely Laurel M
Current Estimated Value
Home Financials for this Owner
Home Financials are based on the most recent Mortgage that was taken out on this home.
Original Mortgage
$398,000
Outstanding Balance
$389,464
Interest Rate
6.9%
Mortgage Type
Purchase Money Mortgage
Estimated Equity
$99,371
Purchase Details
Closed on
Dec 29, 2016
Sold by
Hbd Realty Inc
Bought by
Scott James A
Purchase Details
Closed on
Oct 25, 2013
Sold by
Stergion Elizabeth
Bought by
Hbd Realty Inc
Create a Home Valuation Report for This Property
The Home Valuation Report is an in-depth analysis detailing your home's value as well as a comparison with similar homes in the area
Home Values in the Area
Average Home Value in this Area
Purchase History
| Date | Buyer | Sale Price | Title Company |
|---|---|---|---|
| Conneely Shane | $497,500 | None Available | |
| Scott James A | $45,000 | Stephen V. Rossettie | |
| Hbd Realty Inc | $25,000 | -- |
Source: Public Records
Mortgage History
| Date | Status | Borrower | Loan Amount |
|---|---|---|---|
| Open | Conneely Shane | $398,000 |
Source: Public Records
Tax History Compared to Growth
Tax History
| Year | Tax Paid | Tax Assessment Tax Assessment Total Assessment is a certain percentage of the fair market value that is determined by local assessors to be the total taxable value of land and additions on the property. | Land | Improvement |
|---|---|---|---|---|
| 2024 | $11,259 | $410,000 | $34,400 | $375,600 |
| 2023 | $11,384 | $410,000 | $34,400 | $375,600 |
| 2022 | $16,462 | $350,000 | $31,900 | $318,100 |
| 2021 | $12,109 | $350,000 | $31,900 | $318,100 |
| 2020 | $7,581 | $350,000 | $31,900 | $318,100 |
| 2019 | $15,609 | $350,000 | $31,900 | $318,100 |
| 2018 | $15,609 | $350,000 | $31,900 | $318,100 |
| 2017 | $1,053 | $31,900 | $31,900 | $0 |
| 2016 | $1,042 | $31,900 | $31,900 | $0 |
| 2015 | -- | $31,900 | $31,900 | $0 |
| 2014 | -- | $31,900 | $31,900 | $0 |
Source: Public Records
Map
Nearby Homes