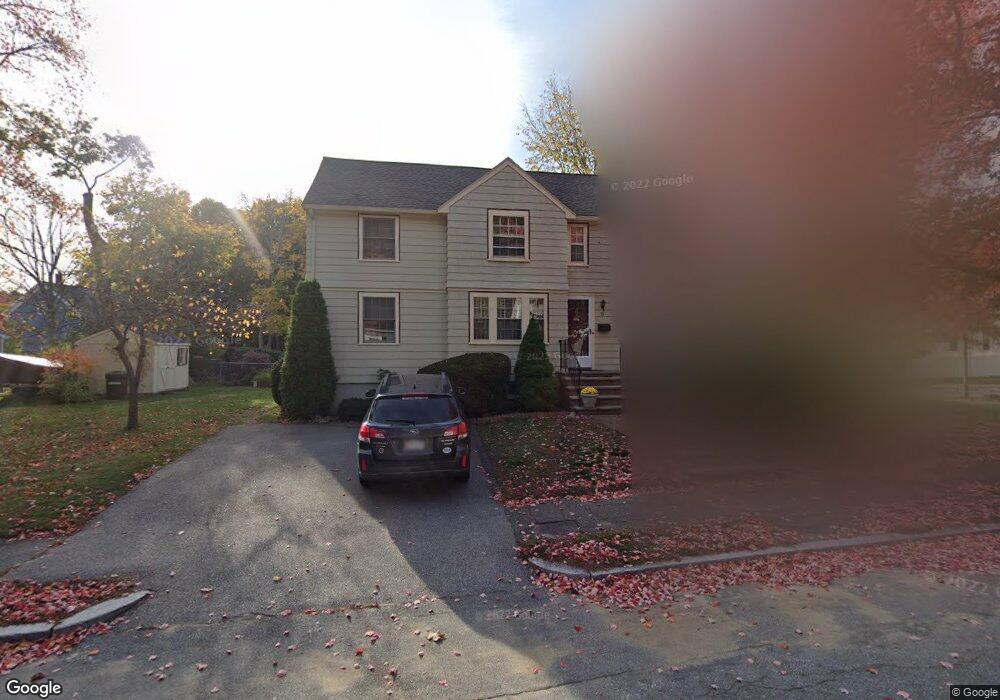
13 Crosby Rd Wakefield, MA 01880
Greenwood NeighborhoodEstimated Value: $737,000 - $825,000
3
Beds
3
Baths
1,518
Sq Ft
$516/Sq Ft
Est. Value
About This Home
This home is located at 13 Crosby Rd, Wakefield, MA 01880 and is currently estimated at $783,405, approximately $516 per square foot. 13 Crosby Rd is a home located in Middlesex County with nearby schools including Wakefield Memorial High School, St Joseph School, and St. Patrick Elementary School.
Ownership History
Date
Name
Owned For
Owner Type
Purchase Details
Closed on
Jun 28, 1999
Sold by
Smith William T Est
Bought by
Cullen Timothy J and Hanlon Rita V
Current Estimated Value
Home Financials for this Owner
Home Financials are based on the most recent Mortgage that was taken out on this home.
Original Mortgage
$199,500
Outstanding Balance
$53,810
Interest Rate
7.09%
Mortgage Type
Purchase Money Mortgage
Estimated Equity
$729,595
Create a Home Valuation Report for This Property
The Home Valuation Report is an in-depth analysis detailing your home's value as well as a comparison with similar homes in the area
Home Values in the Area
Average Home Value in this Area
Purchase History
| Date | Buyer | Sale Price | Title Company |
|---|---|---|---|
| Cullen Timothy J | $210,000 | -- |
Source: Public Records
Mortgage History
| Date | Status | Borrower | Loan Amount |
|---|---|---|---|
| Open | Cullen Timothy J | $199,500 |
Source: Public Records
Tax History Compared to Growth
Tax History
| Year | Tax Paid | Tax Assessment Tax Assessment Total Assessment is a certain percentage of the fair market value that is determined by local assessors to be the total taxable value of land and additions on the property. | Land | Improvement |
|---|---|---|---|---|
| 2025 | $7,836 | $690,400 | $354,600 | $335,800 |
| 2024 | $7,225 | $642,200 | $329,800 | $312,400 |
| 2023 | $7,032 | $599,500 | $307,900 | $291,600 |
| 2022 | $6,595 | $535,300 | $274,900 | $260,400 |
| 2021 | $6,438 | $505,700 | $251,300 | $254,400 |
| 2020 | $6,054 | $474,100 | $235,600 | $238,500 |
| 2019 | $5,677 | $442,500 | $219,900 | $222,600 |
| 2018 | $5,475 | $422,800 | $210,100 | $212,700 |
| 2017 | $5,148 | $395,100 | $196,300 | $198,800 |
| 2016 | $5,040 | $373,600 | $193,800 | $179,800 |
| 2015 | $4,706 | $349,100 | $181,100 | $168,000 |
| 2014 | $4,353 | $340,600 | $176,700 | $163,900 |
Source: Public Records
Map
Nearby Homes
- 1 Sidney St
- 772 Main St Unit 2
- 762 Main St
- 3 Hickory Hill Rd Unit 1
- 24 Myrtle Ave
- 6 Castle Clare Cir
- 61 Forest St
- 9 Lovis Ave
- 70 Old Nahant Rd
- 12 Lovis Ave
- 6 Lovis Ave
- 134 Nahant St Unit B
- 9 Lilah Cir
- 199 Nahant St
- 19 Fellsmere Ave
- 1 Ludlow Ave
- 38 Bennett St Unit 3D
- 81 Spring St
- 35 Richardson St Unit 2
- 22 Mount Zion Rd