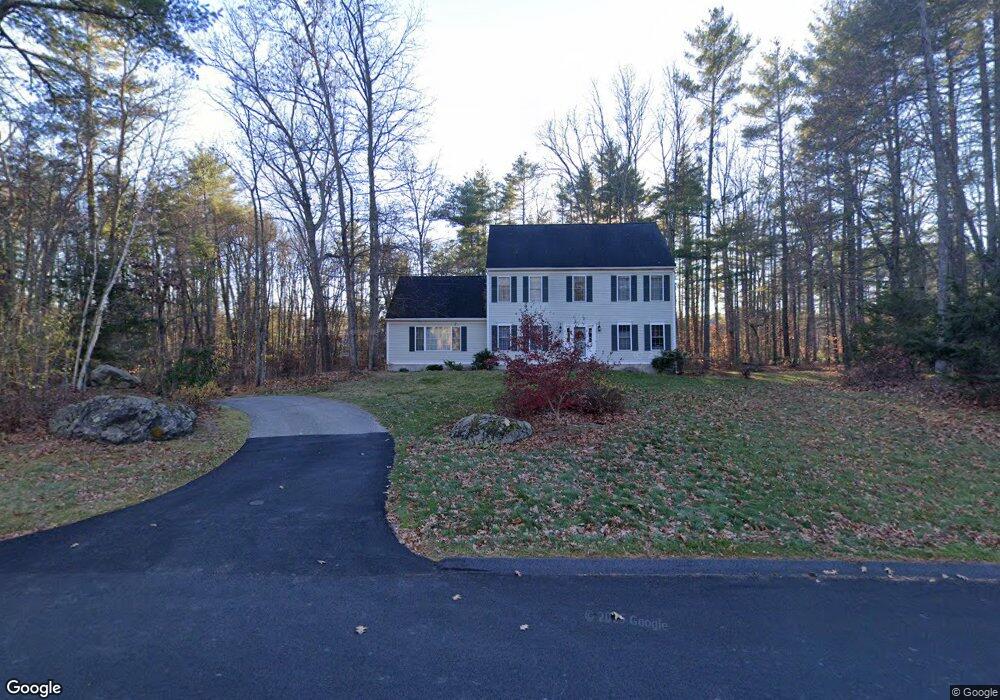
13 Cullen Way Exeter, NH 03833
Estimated Value: $842,848 - $1,006,000
4
Beds
3
Baths
2,670
Sq Ft
$342/Sq Ft
Est. Value
About This Home
This home is located at 13 Cullen Way, Exeter, NH 03833 and is currently estimated at $912,212, approximately $341 per square foot. 13 Cullen Way is a home located in Rockingham County with nearby schools including Main Street School, Lincoln Street Elementary School, and Cooperative Middle School.
Ownership History
Date
Name
Owned For
Owner Type
Purchase Details
Closed on
May 27, 1999
Sold by
Densen Const Inc
Bought by
Hartnett James M and Hartnett Virginia S
Current Estimated Value
Home Financials for this Owner
Home Financials are based on the most recent Mortgage that was taken out on this home.
Original Mortgage
$263,200
Interest Rate
6.82%
Create a Home Valuation Report for This Property
The Home Valuation Report is an in-depth analysis detailing your home's value as well as a comparison with similar homes in the area
Home Values in the Area
Average Home Value in this Area
Purchase History
We collect this data history from publicly available records. To have your information removed, we recommend requesting removal directly through your county’s website.
| Date | Buyer | Sale Price | Title Company |
|---|---|---|---|
| Hartnett James M | $329,000 | -- |
Source: Public Records
Mortgage History
We collect this data history from publicly available records. To have your information removed, we recommend requesting removal directly through your county’s website.
| Date | Status | Borrower | Loan Amount |
|---|---|---|---|
| Open | Hartnett James M | $100,000 | |
| Open | Hartnett James M | $247,000 | |
| Closed | Hartnett James M | $150,000 | |
| Closed | Hartnett James M | $263,200 |
Source: Public Records
Tax History
| Year | Tax Paid | Tax Assessment Tax Assessment Total Assessment is a certain percentage of the fair market value that is determined by local assessors to be the total taxable value of land and additions on the property. | Land | Improvement |
|---|---|---|---|---|
| 2025 | $13,674 | $728,900 | $311,700 | $417,200 |
| 2024 | $12,967 | $728,900 | $311,700 | $417,200 |
| 2023 | $12,482 | $466,100 | $185,700 | $280,400 |
| 2022 | $11,536 | $466,100 | $185,700 | $280,400 |
| 2021 | $11,191 | $466,100 | $185,700 | $280,400 |
| 2020 | $11,415 | $466,100 | $185,700 | $280,400 |
| 2019 | $10,846 | $466,100 | $185,700 | $280,400 |
| 2018 | $10,615 | $386,000 | $138,200 | $247,800 |
| 2017 | $10,333 | $386,000 | $138,200 | $247,800 |
| 2016 | $10,129 | $386,000 | $138,200 | $247,800 |
| 2015 | $9,858 | $386,000 | $138,200 | $247,800 |
| 2014 | $11,599 | $445,100 | $150,700 | $294,400 |
| 2013 | $11,586 | $445,100 | $150,700 | $294,400 |
| 2011 | $11,252 | $445,100 | $150,700 | $294,400 |
Source: Public Records
Map
Nearby Homes
- 2 Riverwoods Dr
- 64 Kingston Rd
- 608 Canterbury Dr
- 95 Kingston Rd
- 422 Friar Tuck Dr
- 18 Boulder Brook Dr Unit 5
- 519 Canterbury Dr
- 614 Canterbury Dr
- 1013 Camelot Dr
- 310 Friar Tuck Dr
- Lot J Longview Place
- Lot L Longview Place
- 609 Canterbury Dr
- 220 Robinhood Dr Unit 220
- 75 Hilton Ave
- 53 Hilton Ave
- 5 John West Rd
- 4 Dow St
- 7 Sir Lancelot Dr
- 139 Robinhood Dr
Your Personal Tour Guide
Ask me questions while you tour the home.