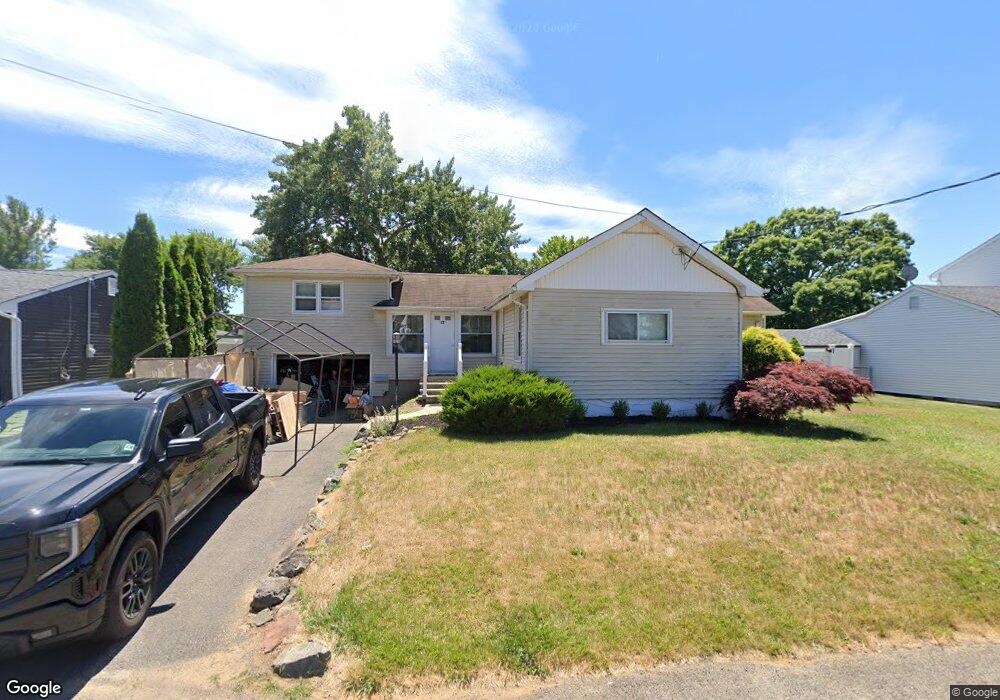
13 Cypress St Hazlet, NJ 07730
Estimated Value: $462,000 - $546,000
3
Beds
1
Bath
1,444
Sq Ft
$345/Sq Ft
Est. Value
About This Home
This home is located at 13 Cypress St, Hazlet, NJ 07730 and is currently estimated at $497,851, approximately $344 per square foot. 13 Cypress St is a home located in Monmouth County with nearby schools including Raritan High School, Icob Academy, and St. Joseph Elementary School.
Ownership History
Date
Name
Owned For
Owner Type
Purchase Details
Closed on
Jul 27, 2011
Sold by
Obrien Sheila
Bought by
Crawford Dana A
Current Estimated Value
Home Financials for this Owner
Home Financials are based on the most recent Mortgage that was taken out on this home.
Original Mortgage
$209,549
Outstanding Balance
$146,300
Interest Rate
4.75%
Mortgage Type
FHA
Estimated Equity
$351,551
Purchase Details
Closed on
Feb 15, 2006
Sold by
Estate Of Mary F Thynne
Bought by
Haggerty James J
Create a Home Valuation Report for This Property
The Home Valuation Report is an in-depth analysis detailing your home's value as well as a comparison with similar homes in the area
Home Values in the Area
Average Home Value in this Area
Purchase History
| Date | Buyer | Sale Price | Title Company |
|---|---|---|---|
| Crawford Dana A | $215,000 | Red Bank Title | |
| Haggerty James J | -- | -- |
Source: Public Records
Mortgage History
| Date | Status | Borrower | Loan Amount |
|---|---|---|---|
| Open | Crawford Dana A | $209,549 |
Source: Public Records
Tax History Compared to Growth
Tax History
| Year | Tax Paid | Tax Assessment Tax Assessment Total Assessment is a certain percentage of the fair market value that is determined by local assessors to be the total taxable value of land and additions on the property. | Land | Improvement |
|---|---|---|---|---|
| 2025 | $8,706 | $456,900 | $252,500 | $204,400 |
| 2024 | $8,554 | $414,000 | $210,500 | $203,500 |
| 2023 | $8,554 | $400,300 | $198,500 | $201,800 |
| 2022 | $8,067 | $329,100 | $151,500 | $177,600 |
| 2021 | $8,067 | $314,500 | $156,500 | $158,000 |
| 2020 | $7,924 | $306,900 | $152,500 | $154,400 |
| 2019 | $7,685 | $293,000 | $139,500 | $153,500 |
| 2018 | $7,430 | $280,900 | $134,500 | $146,400 |
| 2017 | $7,194 | $272,000 | $130,100 | $141,900 |
| 2016 | $7,075 | $268,500 | $130,100 | $138,400 |
| 2015 | $6,962 | $264,900 | $130,100 | $134,800 |
| 2014 | $6,545 | $233,600 | $105,000 | $128,600 |
Source: Public Records
Map
Nearby Homes