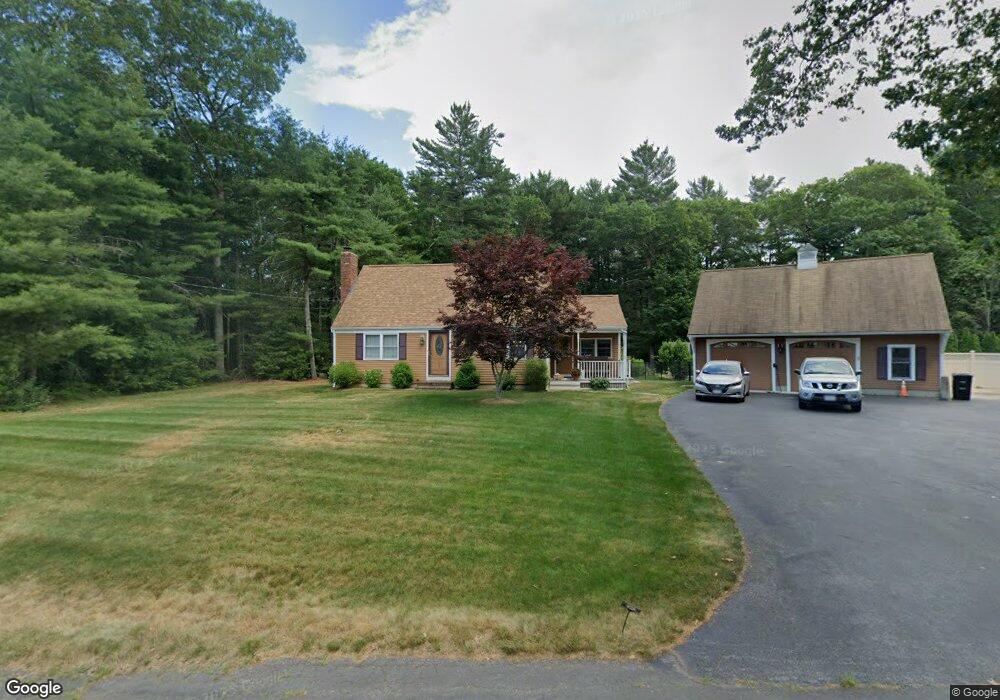
13 Dartmouth St Halifax, MA 02338
Estimated Value: $573,000 - $589,734
3
Beds
2
Baths
1,464
Sq Ft
$397/Sq Ft
Est. Value
About This Home
This home is located at 13 Dartmouth St, Halifax, MA 02338 and is currently estimated at $581,434, approximately $397 per square foot. 13 Dartmouth St is a home located in Plymouth County with nearby schools including Silver Lake Regional High School, Halifax Elementary School, and Silver Lake Regional Middle School.
Ownership History
Date
Name
Owned For
Owner Type
Purchase Details
Closed on
Jun 6, 2014
Sold by
Lowe Jack P and Lowe Jacqueline L
Bought by
Lowe Jeremy P and Lowe Lisi
Current Estimated Value
Home Financials for this Owner
Home Financials are based on the most recent Mortgage that was taken out on this home.
Original Mortgage
$150,000
Outstanding Balance
$114,649
Interest Rate
4.33%
Mortgage Type
New Conventional
Estimated Equity
$466,785
Purchase Details
Closed on
Nov 21, 1997
Sold by
Sneyd Samuel G
Bought by
Lowe Jack P and Lowe Jacqueline L
Create a Home Valuation Report for This Property
The Home Valuation Report is an in-depth analysis detailing your home's value as well as a comparison with similar homes in the area
Home Values in the Area
Average Home Value in this Area
Purchase History
| Date | Buyer | Sale Price | Title Company |
|---|---|---|---|
| Lowe Jeremy P | $200,000 | -- | |
| Lowe Jack P | $148,900 | -- |
Source: Public Records
Mortgage History
| Date | Status | Borrower | Loan Amount |
|---|---|---|---|
| Open | Lowe Jeremy P | $150,000 | |
| Previous Owner | Lowe Jack P | $98,110 | |
| Previous Owner | Lowe Jack P | $108,000 |
Source: Public Records
Tax History Compared to Growth
Tax History
| Year | Tax Paid | Tax Assessment Tax Assessment Total Assessment is a certain percentage of the fair market value that is determined by local assessors to be the total taxable value of land and additions on the property. | Land | Improvement |
|---|---|---|---|---|
| 2025 | $7,546 | $528,800 | $191,200 | $337,600 |
| 2024 | $7,347 | $510,200 | $183,900 | $326,300 |
| 2023 | $7,214 | $484,800 | $178,500 | $306,300 |
| 2022 | $6,992 | $436,700 | $159,400 | $277,300 |
| 2021 | $4,576 | $390,400 | $153,200 | $237,200 |
| 2020 | $6,510 | $373,300 | $153,200 | $220,100 |
| 2019 | $9,665 | $363,600 | $148,800 | $214,800 |
| 2018 | $6,103 | $345,800 | $140,400 | $205,400 |
| 2017 | $4,090 | $330,800 | $140,400 | $190,400 |
| 2016 | $5,640 | $293,000 | $118,700 | $174,300 |
| 2015 | $5,518 | $290,600 | $118,700 | $171,900 |
Source: Public Records
Map
Nearby Homes