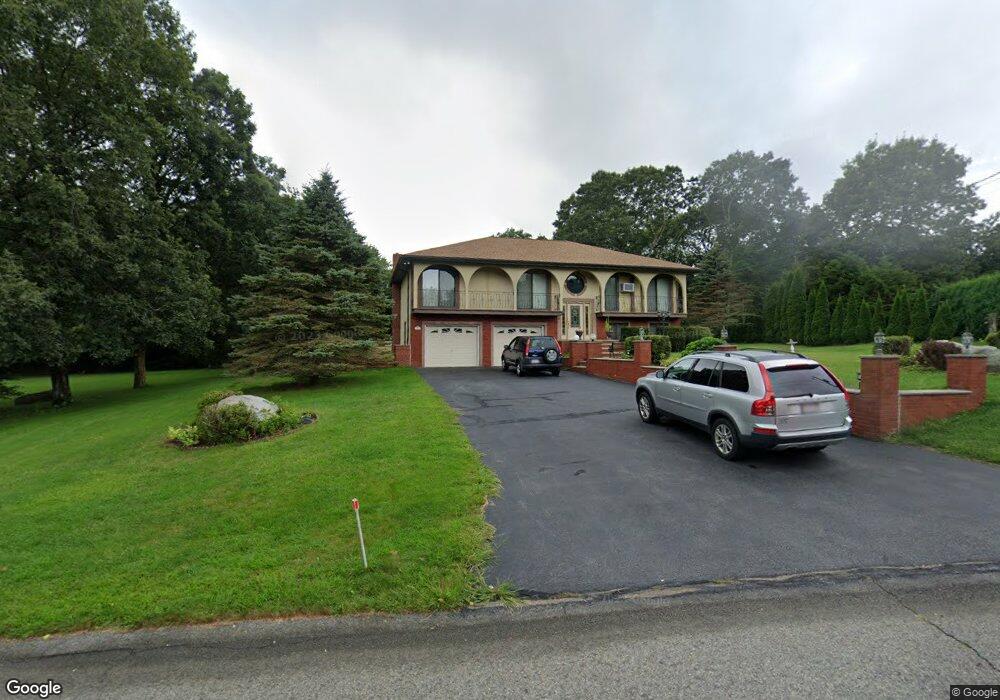
13 Diane Way Westport, MA 02790
Estimated Value: $592,000 - $728,000
3
Beds
--
Bath
1,550
Sq Ft
$420/Sq Ft
Est. Value
About This Home
This home is located at 13 Diane Way, Westport, MA 02790 and is currently estimated at $651,240, approximately $420 per square foot. 13 Diane Way is a home located in Bristol County with nearby schools including Alice A. Macomber Primary School, Westport Elementary School, and Westport Middle-High School.
Ownership History
Date
Name
Owned For
Owner Type
Purchase Details
Closed on
Jan 19, 2007
Sold by
Arruda Antonio D
Bought by
Gonzalez David and Gonzalez Maryann
Current Estimated Value
Home Financials for this Owner
Home Financials are based on the most recent Mortgage that was taken out on this home.
Original Mortgage
$260,000
Interest Rate
6.14%
Mortgage Type
Purchase Money Mortgage
Purchase Details
Closed on
Jul 8, 1994
Sold by
Arruda Antonio D and Arruda Darlene
Bought by
Carreira Sidonio and Carreira Fernanda
Create a Home Valuation Report for This Property
The Home Valuation Report is an in-depth analysis detailing your home's value as well as a comparison with similar homes in the area
Home Values in the Area
Average Home Value in this Area
Purchase History
| Date | Buyer | Sale Price | Title Company |
|---|---|---|---|
| Gonzalez David | $376,000 | -- | |
| Carreira Sidonio | $8,000 | -- |
Source: Public Records
Mortgage History
| Date | Status | Borrower | Loan Amount |
|---|---|---|---|
| Open | Carreira Sidonio | $248,000 | |
| Closed | Carreira Sidonio | $20,000 | |
| Closed | Carreira Sidonio | $260,000 |
Source: Public Records
Tax History Compared to Growth
Tax History
| Year | Tax Paid | Tax Assessment Tax Assessment Total Assessment is a certain percentage of the fair market value that is determined by local assessors to be the total taxable value of land and additions on the property. | Land | Improvement |
|---|---|---|---|---|
| 2025 | $3,480 | $467,100 | $179,200 | $287,900 |
| 2024 | $3,477 | $449,800 | $166,000 | $283,800 |
| 2023 | $3,344 | $409,800 | $151,200 | $258,600 |
| 2022 | $3,204 | $377,800 | $137,500 | $240,300 |
| 2021 | $2,897 | $336,100 | $125,000 | $211,100 |
| 2020 | $2,791 | $331,100 | $120,000 | $211,100 |
| 2019 | $2,885 | $348,900 | $120,000 | $228,900 |
| 2018 | $2,712 | $332,000 | $117,500 | $214,500 |
| 2017 | $2,593 | $325,400 | $113,700 | $211,700 |
| 2016 | $2,424 | $306,500 | $110,000 | $196,500 |
| 2015 | $2,450 | $309,000 | $112,500 | $196,500 |
Source: Public Records
Map
Nearby Homes