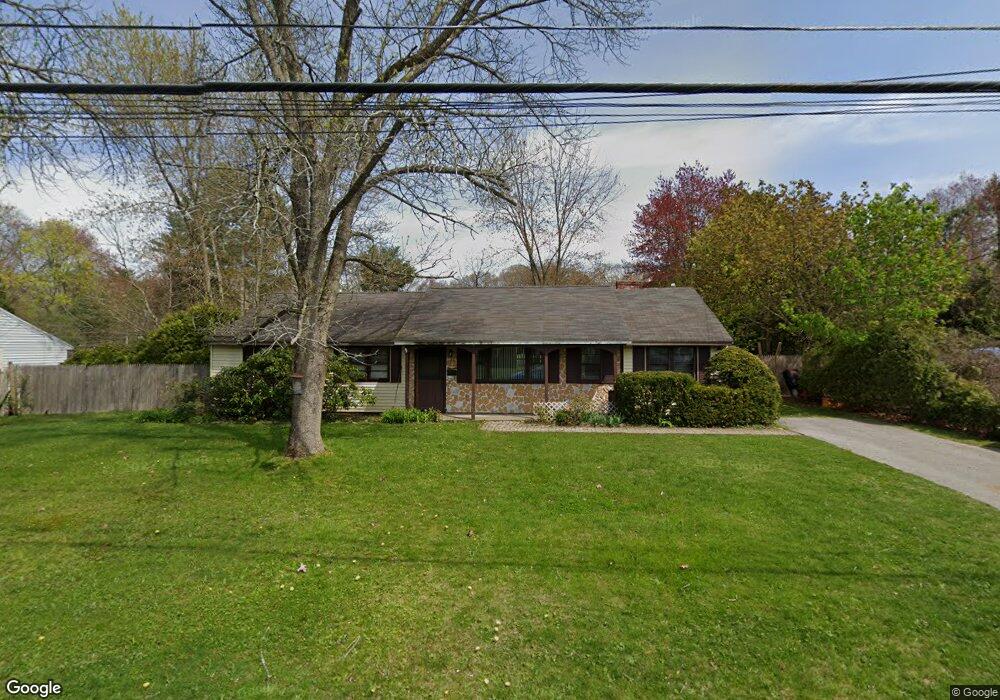
13 Dix Rd Maynard, MA 01754
Estimated Value: $538,324 - $565,000
3
Beds
1
Bath
1,320
Sq Ft
$418/Sq Ft
Est. Value
About This Home
This home is located at 13 Dix Rd, Maynard, MA 01754 and is currently estimated at $551,581, approximately $417 per square foot. 13 Dix Rd is a home located in Middlesex County with nearby schools including Green Meadow School, Fowler School, and Maynard High School.
Ownership History
Date
Name
Owned For
Owner Type
Purchase Details
Closed on
Jan 15, 1999
Sold by
Bartel Michael and Duggan Karen R
Bought by
Peralta Martin and Peralta Tammy
Current Estimated Value
Purchase Details
Closed on
Jun 4, 1998
Sold by
Clark Christopher D and Clark Lisa J
Bought by
Bartel Michael and Duggan Karen R
Purchase Details
Closed on
Aug 30, 1993
Sold by
Gildea William T and Gildea Maura L
Bought by
Clark Christopher D and Clark Lisa S J
Create a Home Valuation Report for This Property
The Home Valuation Report is an in-depth analysis detailing your home's value as well as a comparison with similar homes in the area
Home Values in the Area
Average Home Value in this Area
Purchase History
| Date | Buyer | Sale Price | Title Company |
|---|---|---|---|
| Peralta Martin | $165,500 | -- | |
| Bartel Michael | $145,247 | -- | |
| Clark Christopher D | $129,000 | -- |
Source: Public Records
Mortgage History
| Date | Status | Borrower | Loan Amount |
|---|---|---|---|
| Open | Clark Christopher D | $25,000 | |
| Closed | Clark Christopher D | $10,000 |
Source: Public Records
Tax History
| Year | Tax Paid | Tax Assessment Tax Assessment Total Assessment is a certain percentage of the fair market value that is determined by local assessors to be the total taxable value of land and additions on the property. | Land | Improvement |
|---|---|---|---|---|
| 2025 | $8,284 | $464,600 | $289,400 | $175,200 |
| 2024 | $7,581 | $424,000 | $275,600 | $148,400 |
| 2023 | $7,461 | $393,300 | $262,500 | $130,800 |
| 2022 | $7,053 | $343,700 | $220,500 | $123,200 |
| 2021 | $4,332 | $343,200 | $220,500 | $122,700 |
| 2020 | $6,650 | $322,200 | $199,500 | $122,700 |
| 2019 | $6,413 | $304,800 | $190,600 | $114,200 |
| 2018 | $6,233 | $275,300 | $173,300 | $102,000 |
| 2017 | $6,059 | $275,300 | $173,300 | $102,000 |
| 2016 | $5,850 | $275,300 | $173,300 | $102,000 |
| 2015 | $5,638 | $252,700 | $165,400 | $87,300 |
| 2014 | $5,254 | $235,700 | $160,100 | $75,600 |
Source: Public Records
Map
Nearby Homes
- 153 Summer St
- 10 Mill St Unit B
- 12 Brown St
- 36 Brown St
- 63 Conant St
- 41 Taylor Rd
- 38 Fairfield St
- 22 Douglas Ave Unit 2
- 22 Douglas Ave Unit 1
- 66 Powder Mill Rd
- 68 Powder Mill Rd
- 13 Arthur St Unit 15
- 70 Powder Mill Rd
- 5 Hayes St Unit 5
- 34 Meeting House Ln Unit 208
- 31-33 Roosevelt St
- 6 Beacon Ct
- 23 Deer Path Unit 5
- 40 High St
- 30 Brewster Ln
Your Personal Tour Guide
Ask me questions while you tour the home.