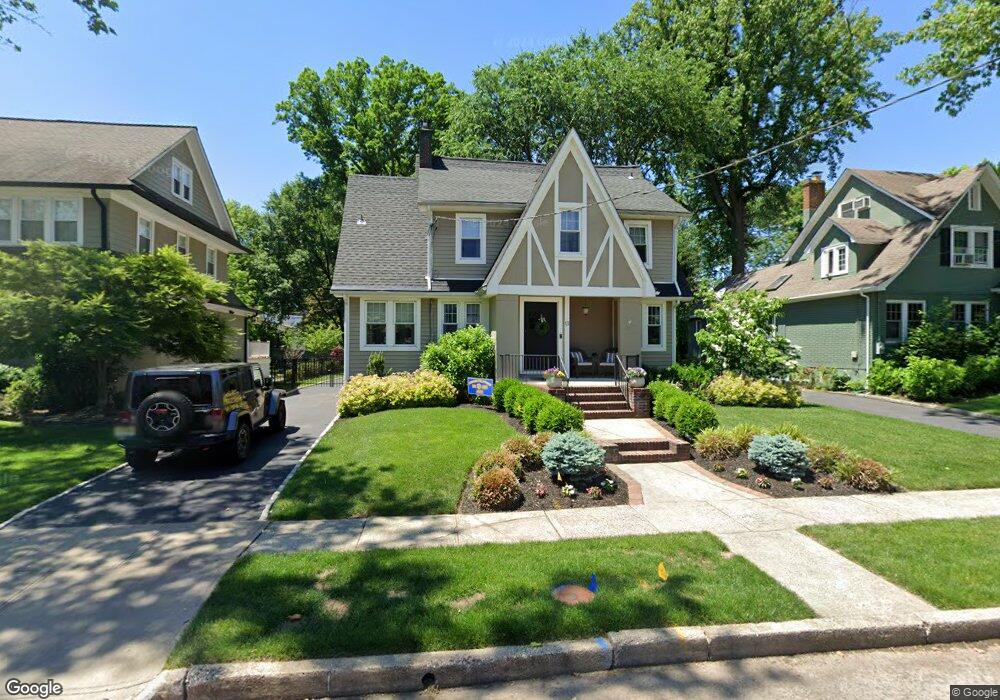
13 Doering Way Cranford, NJ 07016
Estimated Value: $765,000 - $1,115,000
--
Bed
--
Bath
1,925
Sq Ft
$501/Sq Ft
Est. Value
About This Home
This home is located at 13 Doering Way, Cranford, NJ 07016 and is currently estimated at $965,279, approximately $501 per square foot. 13 Doering Way is a home located in Union County with nearby schools including Cranford Sr High School and St Michael School.
Ownership History
Date
Name
Owned For
Owner Type
Purchase Details
Closed on
Jun 13, 2016
Sold by
Kimberly B Mc Kee
Bought by
Johnson John
Current Estimated Value
Home Financials for this Owner
Home Financials are based on the most recent Mortgage that was taken out on this home.
Original Mortgage
$579,500
Outstanding Balance
$461,668
Interest Rate
3.6%
Estimated Equity
$503,611
Purchase Details
Closed on
Jul 30, 2010
Sold by
Merolla Vance A and Merolla Shannon
Bought by
Mckee Kimberly B
Home Financials for this Owner
Home Financials are based on the most recent Mortgage that was taken out on this home.
Original Mortgage
$455,000
Interest Rate
4.73%
Mortgage Type
New Conventional
Purchase Details
Closed on
Dec 1, 2000
Sold by
Baker Alma L
Bought by
Merolla Vance A and Merolla Shannon
Home Financials for this Owner
Home Financials are based on the most recent Mortgage that was taken out on this home.
Original Mortgage
$225,000
Interest Rate
7.64%
Create a Home Valuation Report for This Property
The Home Valuation Report is an in-depth analysis detailing your home's value as well as a comparison with similar homes in the area
Home Values in the Area
Average Home Value in this Area
Purchase History
| Date | Buyer | Sale Price | Title Company |
|---|---|---|---|
| Johnson John | -- | -- | |
| Mckee Kimberly B | $580,000 | Infinity Title Agency Inc | |
| Merolla Vance A | $300,000 | -- |
Source: Public Records
Mortgage History
| Date | Status | Borrower | Loan Amount |
|---|---|---|---|
| Open | Johnson John | $579,500 | |
| Closed | Johnson John | -- | |
| Previous Owner | Mckee Kimberly B | $455,000 | |
| Previous Owner | Merolla Vance A | $225,000 |
Source: Public Records
Tax History Compared to Growth
Tax History
| Year | Tax Paid | Tax Assessment Tax Assessment Total Assessment is a certain percentage of the fair market value that is determined by local assessors to be the total taxable value of land and additions on the property. | Land | Improvement |
|---|---|---|---|---|
| 2025 | $15,727 | $232,000 | $111,600 | $120,400 |
| 2024 | $15,467 | $232,000 | $111,600 | $120,400 |
| 2023 | $15,467 | $232,000 | $111,600 | $120,400 |
| 2022 | $15,340 | $232,000 | $111,600 | $120,400 |
| 2021 | $15,273 | $232,000 | $111,600 | $120,400 |
| 2020 | $15,224 | $232,000 | $111,600 | $120,400 |
| 2019 | $15,126 | $232,000 | $111,600 | $120,400 |
| 2018 | $14,853 | $232,000 | $111,600 | $120,400 |
| 2017 | $14,342 | $232,000 | $111,600 | $120,400 |
| 2016 | $13,820 | $232,000 | $111,600 | $120,400 |
| 2015 | $13,458 | $232,000 | $111,600 | $120,400 |
| 2014 | $13,182 | $232,000 | $111,600 | $120,400 |
Source: Public Records
Map
Nearby Homes