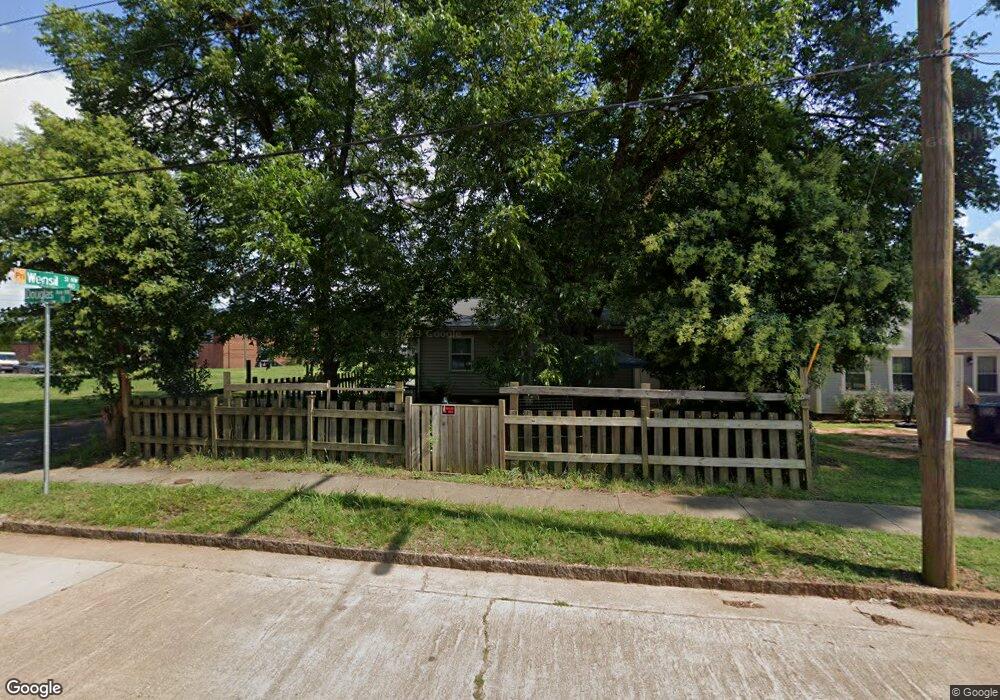
13 Douglas Ave NW Concord, NC 28025
Estimated Value: $174,000 - $206,596
2
Beds
1
Bath
840
Sq Ft
$225/Sq Ft
Est. Value
About This Home
This home is located at 13 Douglas Ave NW, Concord, NC 28025 and is currently estimated at $189,399, approximately $225 per square foot. 13 Douglas Ave NW is a home located in Cabarrus County with nearby schools including Coltrane-Webb Elementary School, Concord Middle School, and Concord High School.
Ownership History
Date
Name
Owned For
Owner Type
Purchase Details
Closed on
Mar 27, 2024
Sold by
Sangster Doobay
Bought by
Sangster Investments Llc
Current Estimated Value
Home Financials for this Owner
Home Financials are based on the most recent Mortgage that was taken out on this home.
Original Mortgage
$115,240
Outstanding Balance
$113,482
Interest Rate
6.77%
Mortgage Type
New Conventional
Estimated Equity
$75,917
Purchase Details
Closed on
May 1, 2014
Sold by
Bodiker Thomas E and Bodiker Lisa K
Bought by
Sangster Doobay
Purchase Details
Closed on
Oct 13, 2004
Sold by
Bayliff Lloyd Theodore and Bayliff Elizabeth Haskins
Bought by
Bodiker Thomas E and Bodiker Lisa K
Home Financials for this Owner
Home Financials are based on the most recent Mortgage that was taken out on this home.
Original Mortgage
$43,200
Interest Rate
5.71%
Mortgage Type
Construction
Create a Home Valuation Report for This Property
The Home Valuation Report is an in-depth analysis detailing your home's value as well as a comparison with similar homes in the area
Home Values in the Area
Average Home Value in this Area
Purchase History
| Date | Buyer | Sale Price | Title Company |
|---|---|---|---|
| Sangster Investments Llc | -- | None Listed On Document | |
| Sangster Investments Llc | -- | None Listed On Document | |
| Sangster Doobay | $25,000 | None Available | |
| Bodiker Thomas E | $48,000 | -- |
Source: Public Records
Mortgage History
| Date | Status | Borrower | Loan Amount |
|---|---|---|---|
| Open | Sangster Investments Llc | $115,240 | |
| Closed | Sangster Investments Llc | $115,240 | |
| Previous Owner | Bodiker Thomas E | $43,200 |
Source: Public Records
Tax History Compared to Growth
Tax History
| Year | Tax Paid | Tax Assessment Tax Assessment Total Assessment is a certain percentage of the fair market value that is determined by local assessors to be the total taxable value of land and additions on the property. | Land | Improvement |
|---|---|---|---|---|
| 2025 | $1,819 | $182,650 | $80,000 | $102,650 |
| 2024 | $1,819 | $182,650 | $80,000 | $102,650 |
| 2023 | $977 | $80,090 | $41,150 | $38,940 |
| 2022 | $977 | $80,090 | $41,150 | $38,940 |
| 2021 | $977 | $80,090 | $41,150 | $38,940 |
| 2020 | $977 | $80,090 | $41,150 | $38,940 |
| 2019 | $712 | $58,330 | $23,500 | $34,830 |
| 2018 | $700 | $58,330 | $23,500 | $34,830 |
| 2017 | $688 | $58,330 | $23,500 | $34,830 |
| 2016 | -- | $53,110 | $19,880 | $33,230 |
| 2015 | $627 | $53,110 | $19,880 | $33,230 |
| 2014 | $627 | $53,110 | $19,880 | $33,230 |
Source: Public Records
Map
Nearby Homes
- 63 Brookwood Ave NW
- 1 Buffalo Ave NW Unit 81
- 471 Hillandale St NE
- 19 Todd Dr NE
- 59 Mckinnon Ave NE
- 147 Madison Ave NE
- 113 Mcgill Ave NW
- 606 Camrose Cir NE
- 169 Freeze Ave NW
- 125 Todd Dr NW
- 336 Hamilton Dr NE
- 629 Camrose Cir NE Unit 45
- 166 Mckinnon Ave NE
- 649 Camrose Cir NE
- 653 Camrose Cir NE
- 81 Academy Ave NW
- 584 Allison St NW
- 138 Tetbury Ave NE
- 528 Gibson Dr NW
- 636 Forest St NW
- 17 Douglas Ave NW
- 399 Church St N
- 407 Church St N
- 393 Church St N
- 23 Douglas Ave NW
- 389 Church St N
- 10 Douglas Ave NW
- 25 Douglas Ave NW
- 14 Douglas Ave NW
- 16 Douglas Ave NW
- 385 Church St N Unit 3
- 385 Church St N
- 22 Douglas Ave NW
- 31 Douglas Ave NW
- 16 Saint Mary Ave NW
- 381 Church St N
- 394 Church St N
- 400 Church St N
- 26 Douglas Ave NW
- 20 Saint Mary Ave NW